Geospatial Analysis

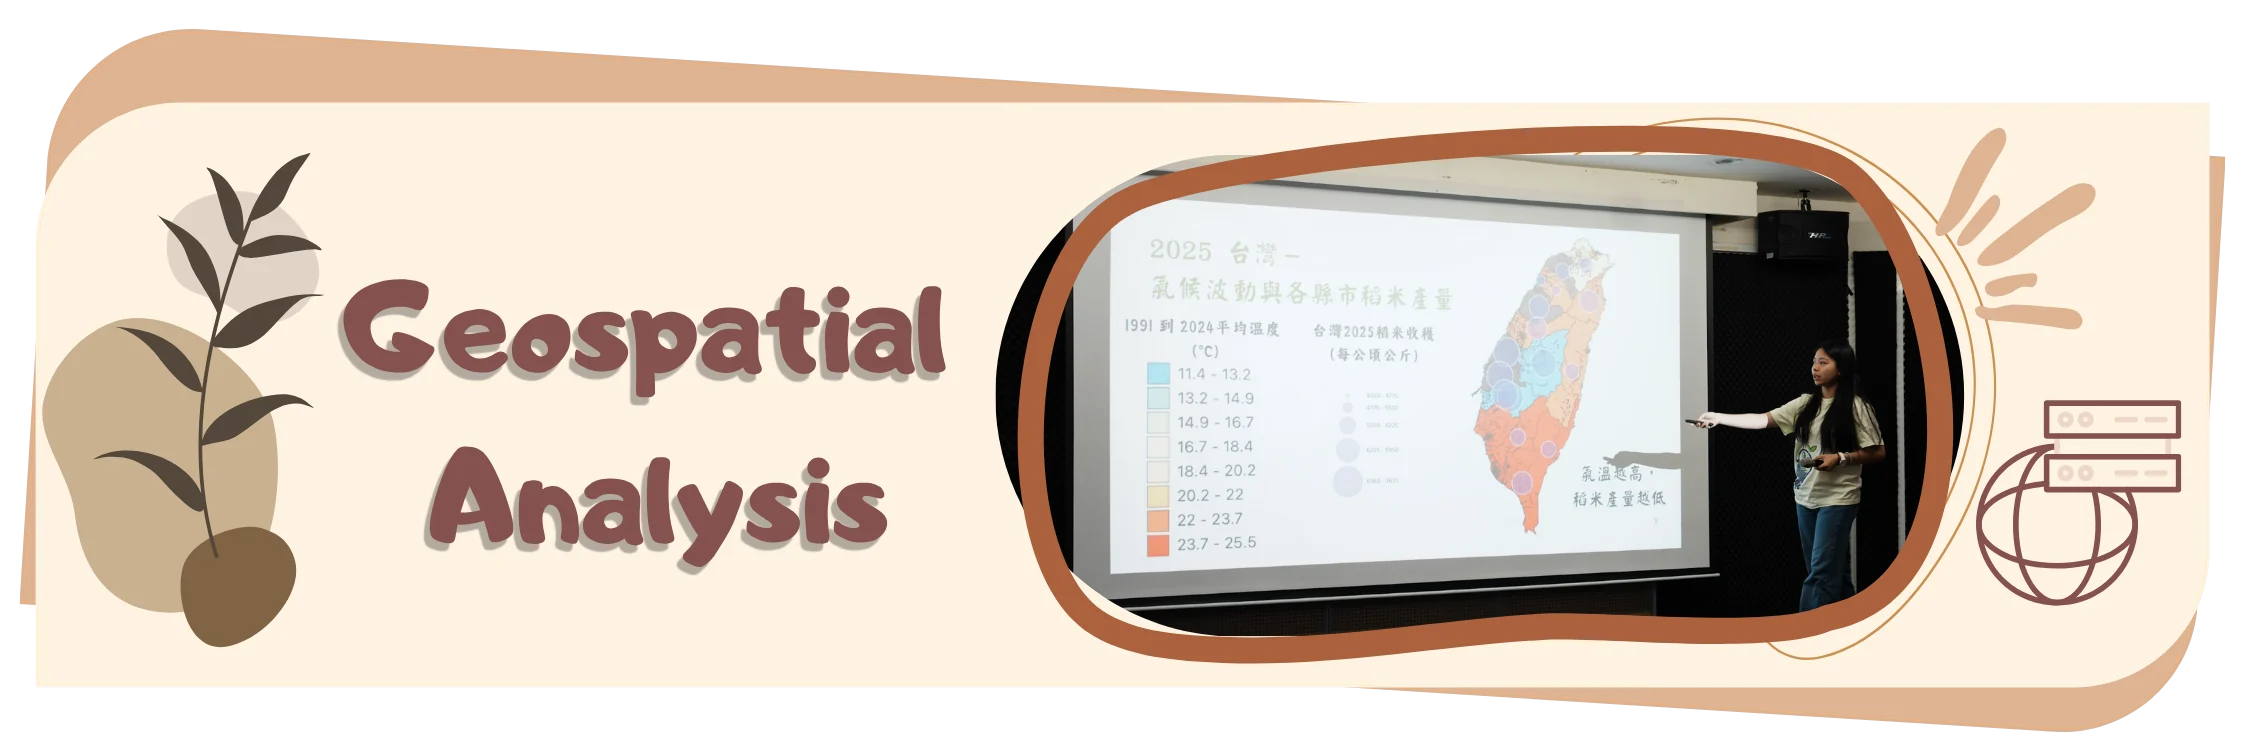
Geospatial Analysis. A team member stands beside a projection screen at the public forum, pointing at a colour-coded map of Taiwan showing 1991 to 2024 mean temperature against county rice yields.

Abstract

The farmers with the least land, the least capital buffer, and often the least physical capacity to adapt quickly are disproportionately the ones farming in Taiwan’s most volatile microclimates.

Several of the counties with the oldest farming populations are also seeing among the sharpest rises in heat stress. Since 99% of Taiwanese farmers work under 2 hectares, individual ownership is arithmetically out of reach for nearly the entire target sector. Soil classification accuracy doesn't just affect the map; it determines whether the ownership model above is financially viable in a given township. This is the strongest argument for replacing the placeholder classification with parcel-resolved TARI soil survey data.

Contents

On this page

Abstract

Precision agriculture offers compelling logic, but it was built for scale — capital, infrastructure, and land large enough to justify the cost. For Taiwan, an island committed to agricultural self-reliance, that model is the wrong shape. ReLEAF was built to reshape it.

In Taiwan, 99.2% of farms are small-scale (under 2 hectares), yet together they work 85.3% of the island's farmed land, on terrain where a single region can span a temperature range rivaling the distance between Miami and Anchorage. This analysis uses geographic information systems to map where that mismatch becomes measurable: where accelerating warming — including the nighttime heat known to quietly suppress rice yield — converges with the farmland smallest in scale, oldest in stewardship, and least resourced to respond, and where centralized solutions like fertilizer distribution add distance and cost rather than closing the gap and addressing the need. Farmer interviews, field visits, and surveys across farmers’ associations ground these findings in lived experience.

This convergence of stress, vulnerability, and infrastructural mismatch is what ReLEAF answers – a decentralized biomanufacturing system built to put precision-level responsiveness directly into the hands of individual smallholder farmers, at a scale precision agriculture has not yet been designed to reach.

Introduction

Single interviews cannot establish whether what one farmer describes is an isolated hardship or a structural pattern. Answering this requires working at a different scale entirely: parcel-level land records, station-level climate data, and demographic surveys, aggregated across nations, across all counties of Taiwan rather than gathered farm by farm. That is the gap geospatial analysis is built to close, and it is why this project relies on it rather than case studies alone.

Existing geospatial studies of Taiwanese agriculture tend to treat variables in isolation: climate-trend analyses map warming or rainfall change without reference to who farms the affected land, while agricultural demographic surveys report vulnerability without a spatial climate layer to test it against. None, to our knowledge, overlay farmland fragmentation, climate volatility, and a documented crop-stress threshold at the parcel or township level simultaneously.

This analysis layers those variables over each other instead of examining any one alone: climate stress (accelerating mean warming), land structure (parcel-level farm size and fragmentation), and demographic vulnerability (farmer age by county) – combined into a single spatial framework rather than completely separate maps. A county can be old without being volatile, or fragmented without being hot; it's the overlap of variables that flags where an intervention is most urgently needed. Beyond this, overlap doesn’t stop at the map; it feeds the dry lab’s math model, which converts the flagged conditions into a per-hectare bioreactor requirement. Following this, it's checked against the wet lab's own stress-response data, so the map's "who needs this" and the bench's "does this work" can answer each other. Which is then cross-referenced against Human Practices' direct farmer interviews, so the pattern in the data is tested against what people are actually living through. That overlap is what determines where a stress-responsive intervention like ReLEAF should be deployed first, and closing it is the purpose of the geospatial analysis presented here.

Problem statement

Global climate stress

Rice is the primary calorie source for more than half the world's population, and across Asia it is grown at every scale — from smallholder plots to industrial acreage — as both a staple food and an economic backbone. This dependence is exactly what makes rice's sensitivity to warming so consequential. The danger isn’t the daytime heat everyone feels – it’s what happens after dark. A landmark study spearheaded by researchers at UC Davis, the International Rice Research Institute in Manila, and collaborators in Guangzhou and Wuhan tracked a Philippine research station over 25 years and found that nighttime minimum temperatures rose more than three times faster than daytime maximums beginning from between 1979 and 2003. Grain yield fell measurably for every degree that nighttime temperature climbed, with documentations showing a drop in 10 percent yield per each rise in degree, while daytime heat on its own showed almost no effect.

The mechanism is almost cruel in its subtlety. During the day, rice photosynthesizes and stores sugar. At night, rice ideally conserves what it built. However, warmer nights keep the plant’s metabolism running even in the dark, burning through those reserves before they can become grain. In this sense, the fields look completely healthy at sunrise while quietly starving itself of the harvest it was building the day before.
Animated world map of projected irrigated rice yield from 2006 to 2098, green for high yield and red for low, with the high-yield belt shrinking over the century.
Figure 1. Global rice Yield Documentation to Forecasting: Year 2006 to 2100

This global yield projection shows the scale of what is at stake: much of the world’s high-yield rice belt sits inside a temperature band that is now shifting. Zoomed out, this looks like a distant problem. Zoomed into any single country with a rice-dependent food system, the problem is urgent — and Taiwan is one of the clearest cases of that shift already underway.

Revealing climate stress and farmland

Taiwan’s geographical and climate variability arguably makes the island’s farmers more vulnerable to agricultural stress. Taiwan is barely 400 kilometers long, yet it holds both a tropical and a subtropical climate. A three-hour drive from Kaohsiung to Jade Mountain crosses a temperature range of roughly 19ºC. This nearly matches the difference between Miami and Anchorage, two cities on opposite ends of a continent, 5,700 kilometers apart. In other words, most countries’ climate shift gradually across vast land areas; Taiwan’s can shift by double digits within an afternoon drive.

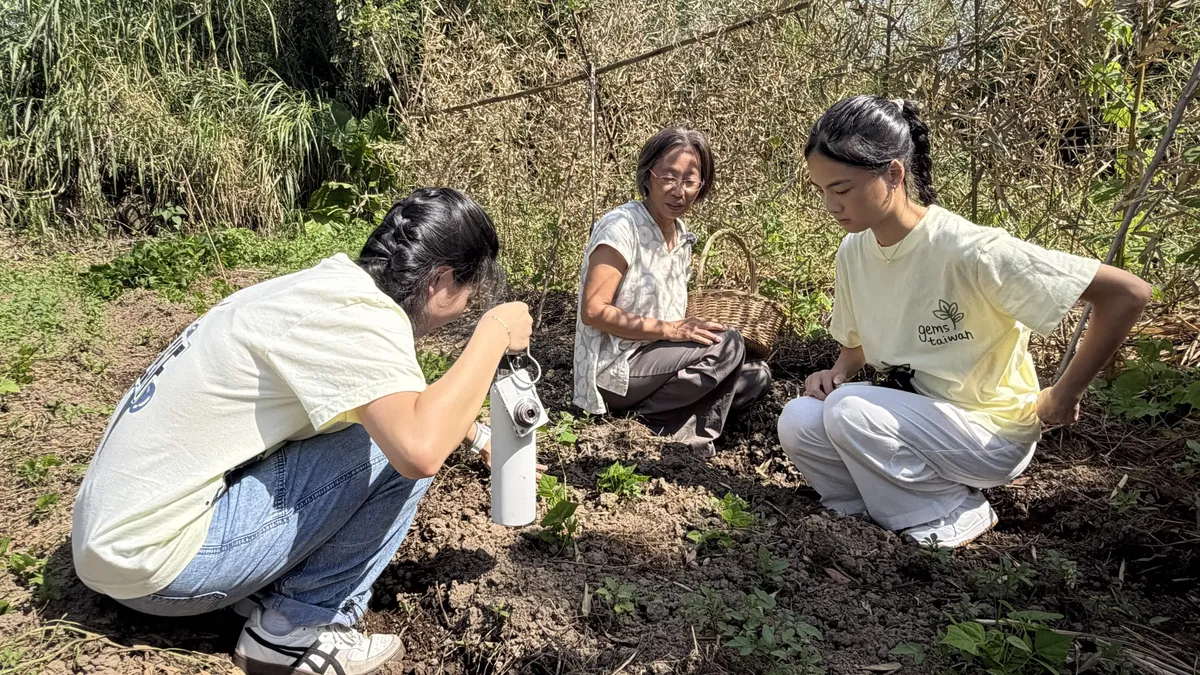
This compression extends underground as well. Ms. Chen, who has run a natural farm in northwest Taiwan for 25 years, put it simply in our interview:

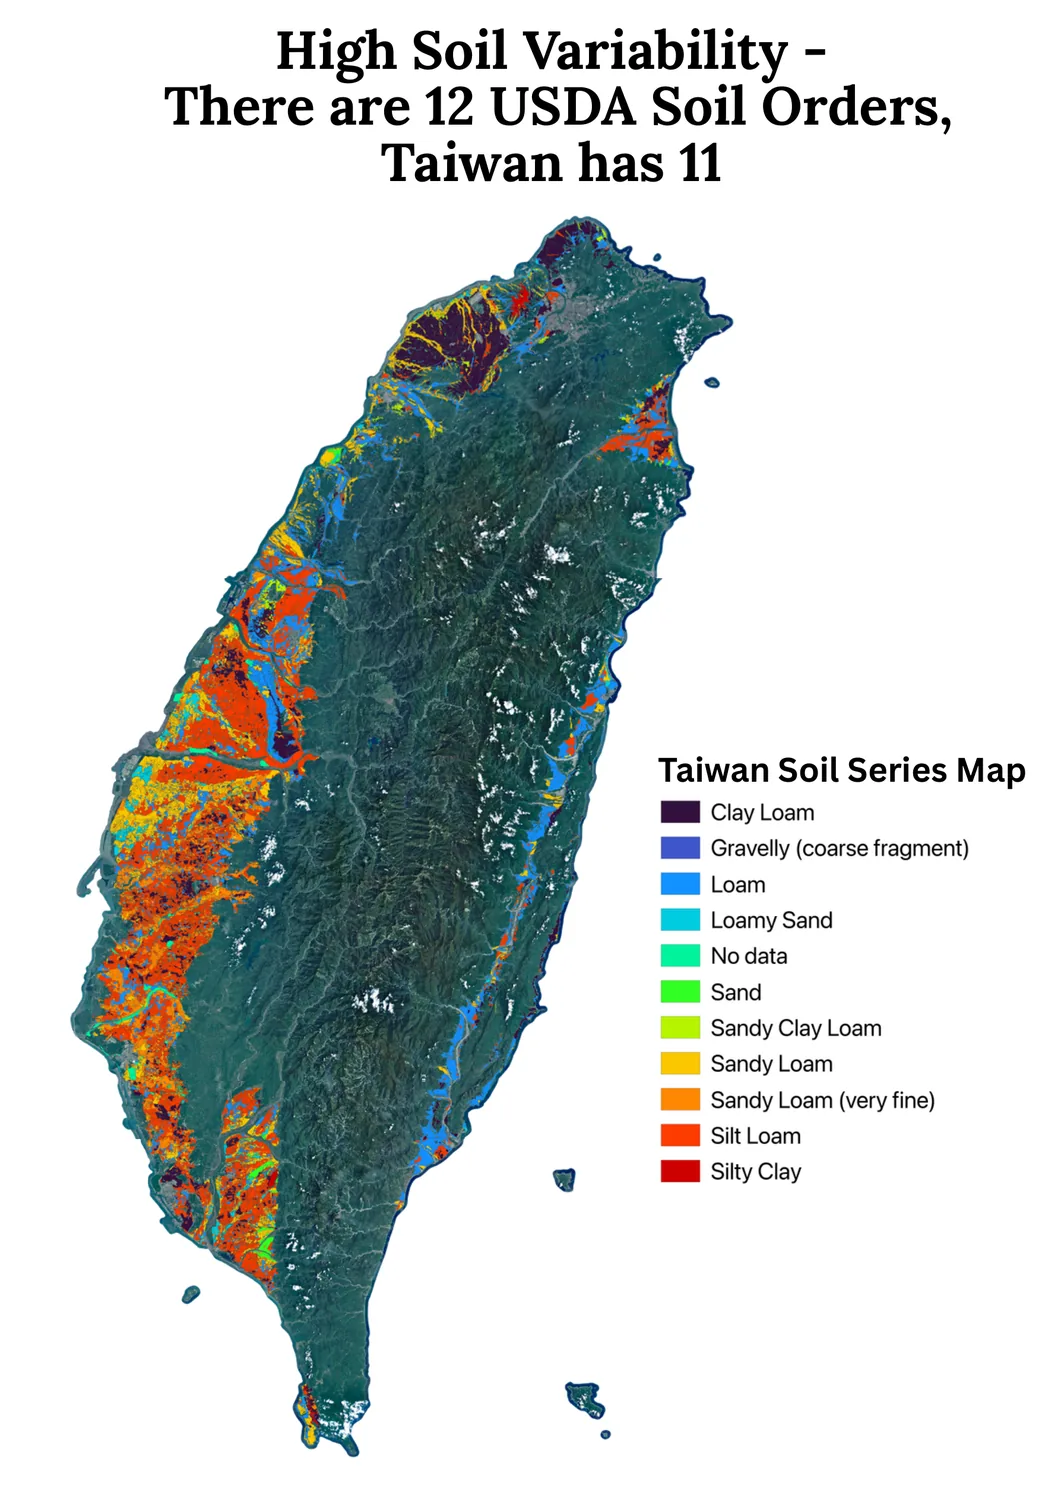
“Even the world’s top soil microbiology PhD doesn’t fully understand Taiwan’s soil… Earth has about 12 soil classification types, and Taiwan alone has 11 of them.”

All variability stacked together, rather than one broad agricultural tradition, Taiwan’s farming knowledge has evolved into thousands of hyper-local, inherited practices, each tuned to a single slope or valley.

Ms. Chen crouching in a sunlit field beside a harvest basket, talking to two ReLEAF students who are crouched on either side of her, all three looking down at a patch of bare dark soil between them.
Map of Taiwan titled High Soil Variability: there are 12 USDA soil orders, Taiwan has 11. Soil series are coloured over satellite imagery, from clay loam through loam, sandy loam and silt loam to silty clay, changing colour every few kilometres down the western plain.
Figure 2. Soil variability.

Figure 2 is the visual argument behind Ms. Chen’s quote: soil shifts, soil type shifts block by block along the western plain, from alluvium to schist to mudstone. Thus, being in the same county doesn’t assure similar planting methods. Consequently, a farming method tuned for one farmer can be the wrong answer for another.

The underlying fragmentation innate to Taiwan is now colliding with a warming rate that continues to outpace tradition’s ability to adapt. For nearly a century, Taiwan’s average temperature crept upward by around 0.11ºC per decade – slow enough that a farmer could spend a lifetime farming and barely notice. Since 1991, that rate has nearly tripled to 0.29ºC per decade, with 2024 becoming Taiwan’s hottest year on record, with Taipei logging 63 days above 35ºC.

The warming isn’t uniform across Taiwan’s counties, and neither is the consequence. Several regions with the sharpest temperature rise since 1980 also show the steepest contractions in rice-growing area relative to 2005. This serves as direct, county-level evidence that the warming trend and the shrinking of rice cultivation are moving together, not independently.

Two animated county maps of Taiwan side by side, year by year from 1980 to 2026: warming at each weather station since 1980 on the left, change in rice-growing area relative to 2005 on the right.
Figure 3. Increased Heat Stress Reduces Rice Crop Yield (1980-2026).

When asked how she gets ahead of the dry season, Ms. Chen described laying dried weeds across her soil before the rains, so that morning dew catches in the weeds and soaks slowly into the ground beneath. This is a method built on a promise she has watched hold for years: soil treated this way could carry her plants for up to three weeks before she needed to check on them again. This is a “clock” built from decades of reading her exact plot of land.

This clock is what causes climate change to reset day by day. A 2022 global study from researchers at the University of Texas at Austin, Hong Kong Polytechnic University, and Texas Tech University found that flash droughts — soil moisture collapsing in a matter of days — aren't necessarily becoming more frequent, but they are arriving significantly faster, with nearly half now developing within a single five-day window instead of unfolding over weeks. This means, when a drought that used to take three weeks to set in now takes closer to two, "right on schedule" quietly becomes "already too late.”

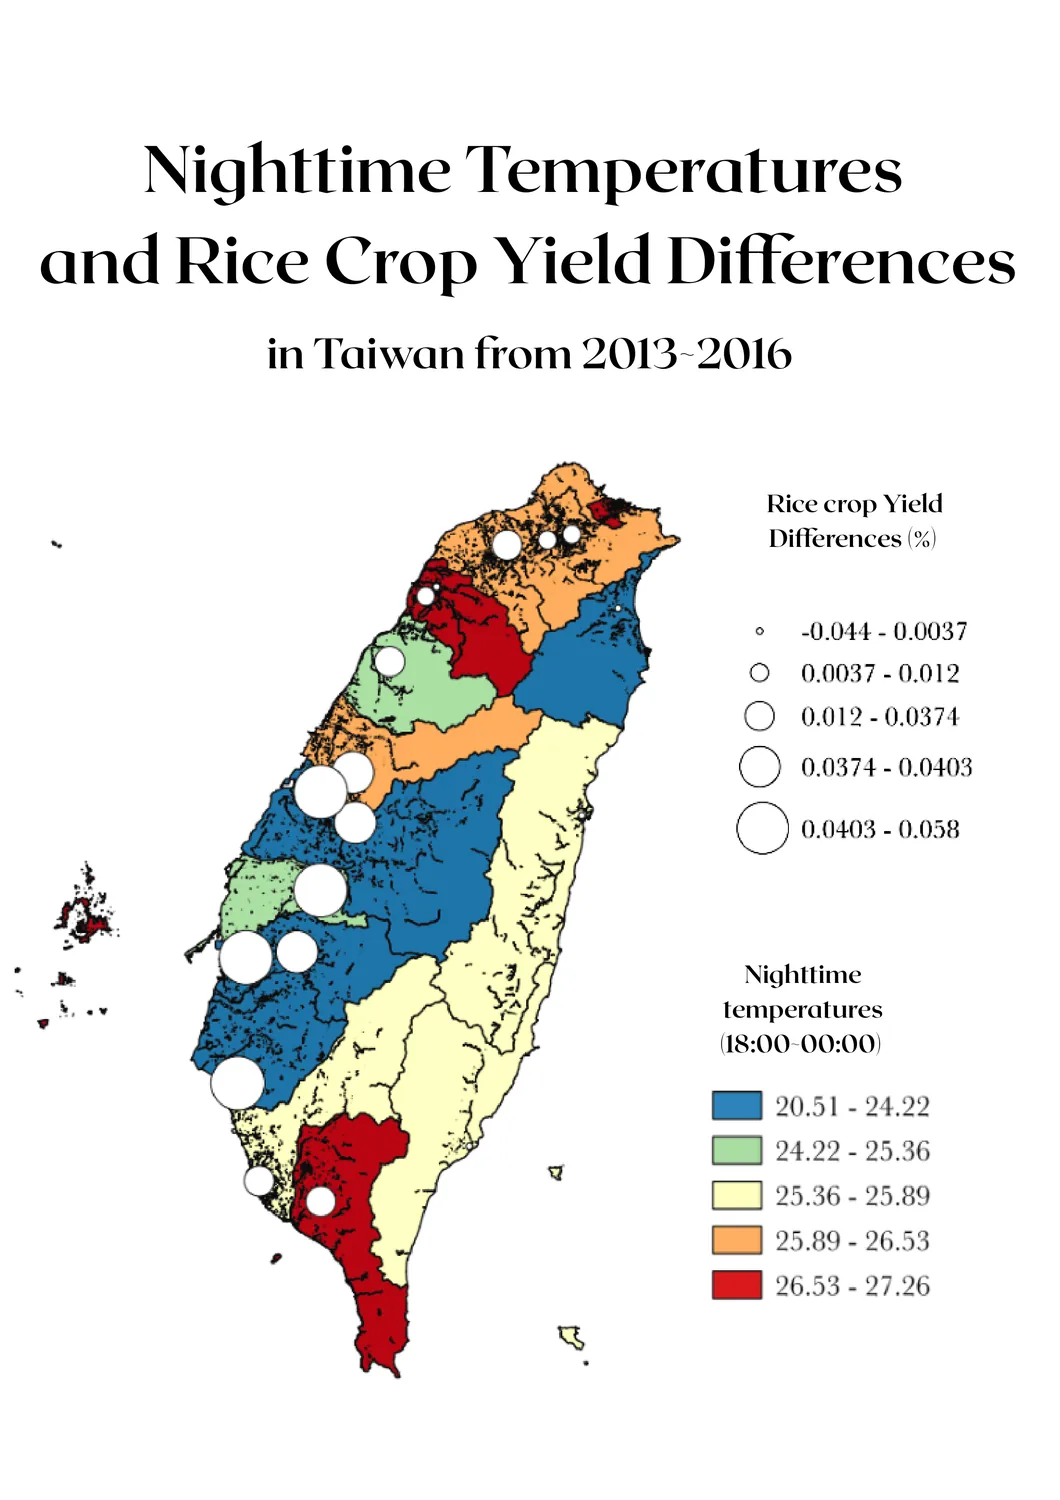
Map of Taiwan titled Nighttime Temperatures and Rice Crop Yield Differences in Taiwan from 2013 to 2016. Counties are shaded by nighttime temperature (18:00 to 00:00) from blue at 20.5 °C to red at 27.3 °C, with white circles along the western plain sized by rice yield difference.
Figure 4. Taiwan County Night-Time Temperature vs. Rice Crop Yields.

Figure 4 places several of the counties that anchor Taiwan's rice belt — including Yilan, on the northeast coast — inside that same high-risk nighttime-temperature band. It isn't an abstraction to the farmers working that band. At our public forum, a rice farmer from Yilan described a continuous shrink in harvest in the past few years, with the main culprits being anthracnose and rice blast, which are two fungal diseases that thrive under exactly the warm, humid conditions the nighttime-temperature data above is tracking. His field is a firsthand account of the same mechanism the global research describes.

Taiwan agricultural demographics

In Taiwan, 99.2% of farmers are small-scale farmers (< 2 hectares of land). While their average farm holds just 0.9 to 1.1 hectares, together, small-scale farmers hold up to 85.3% of Taiwan’s arable land.

The average Taiwanese farmer is 63.5 years old, and more than half of all farmers are over 65. Accurate, early response to crop stress has traditionally depended on someone who can walk a field and read it; yet, that skill is disappearing as the farming population ages.

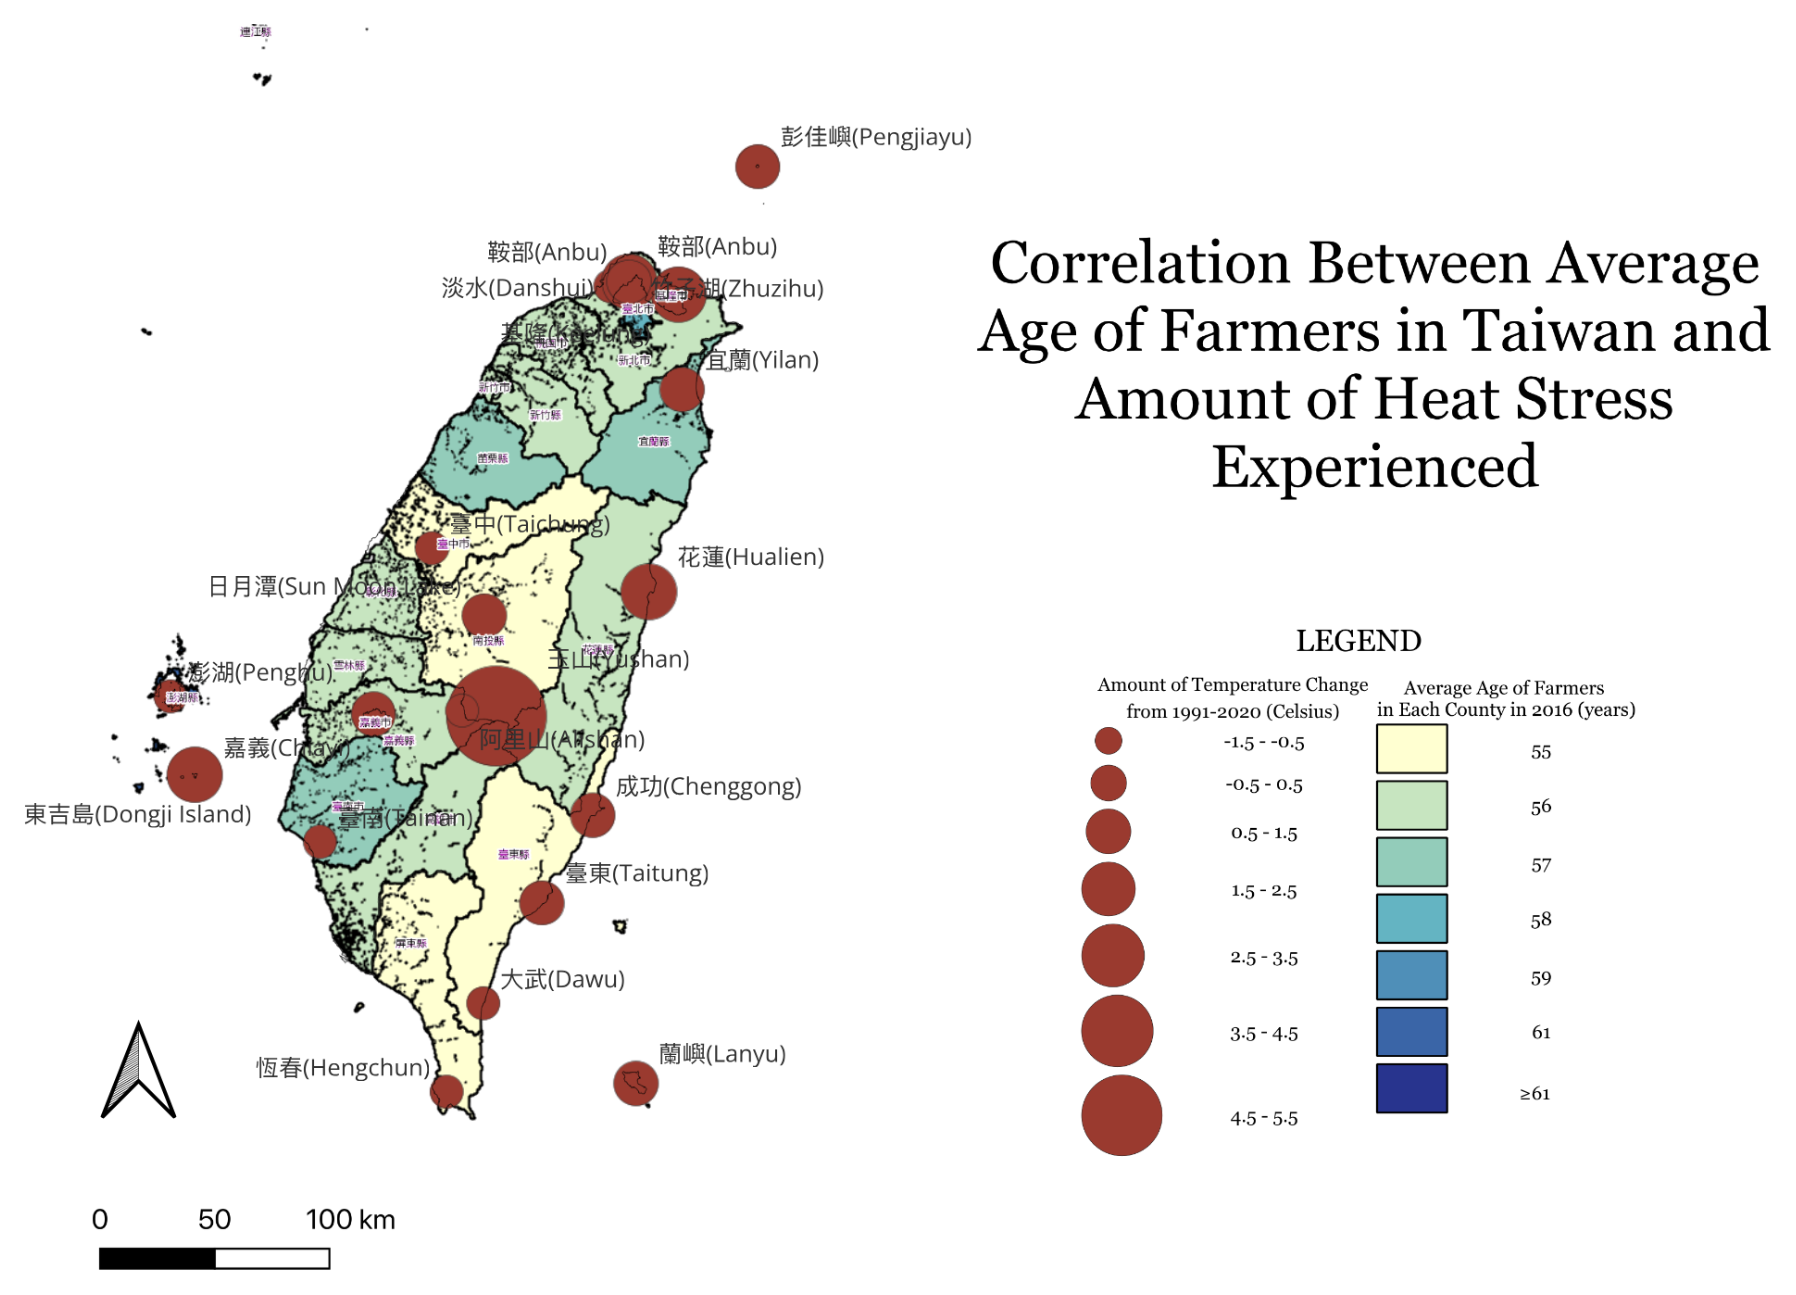
Overlaying county-level farmer age against temperature change from 1999 to 2020 shows these two burdens are not independent: several of the counties with the oldest farming populations are also seeing among the sharpest rises in heat stress. This means the demographic least equipped to respond quickly is concentrated in the places where conditions are changing fastest.

Map of Taiwan titled Correlation Between Average Age of Farmers in Taiwan and Amount of Heat Stress Experienced. Counties are shaded by average farmer age in 2016, from 55 years in pale yellow to 61 and over in dark blue, overlaid with dark red circles at weather stations sized by temperature change from 1991 to 2020.
Figure 5. Average Age of Farmers vs. Heat Stress Intensity.
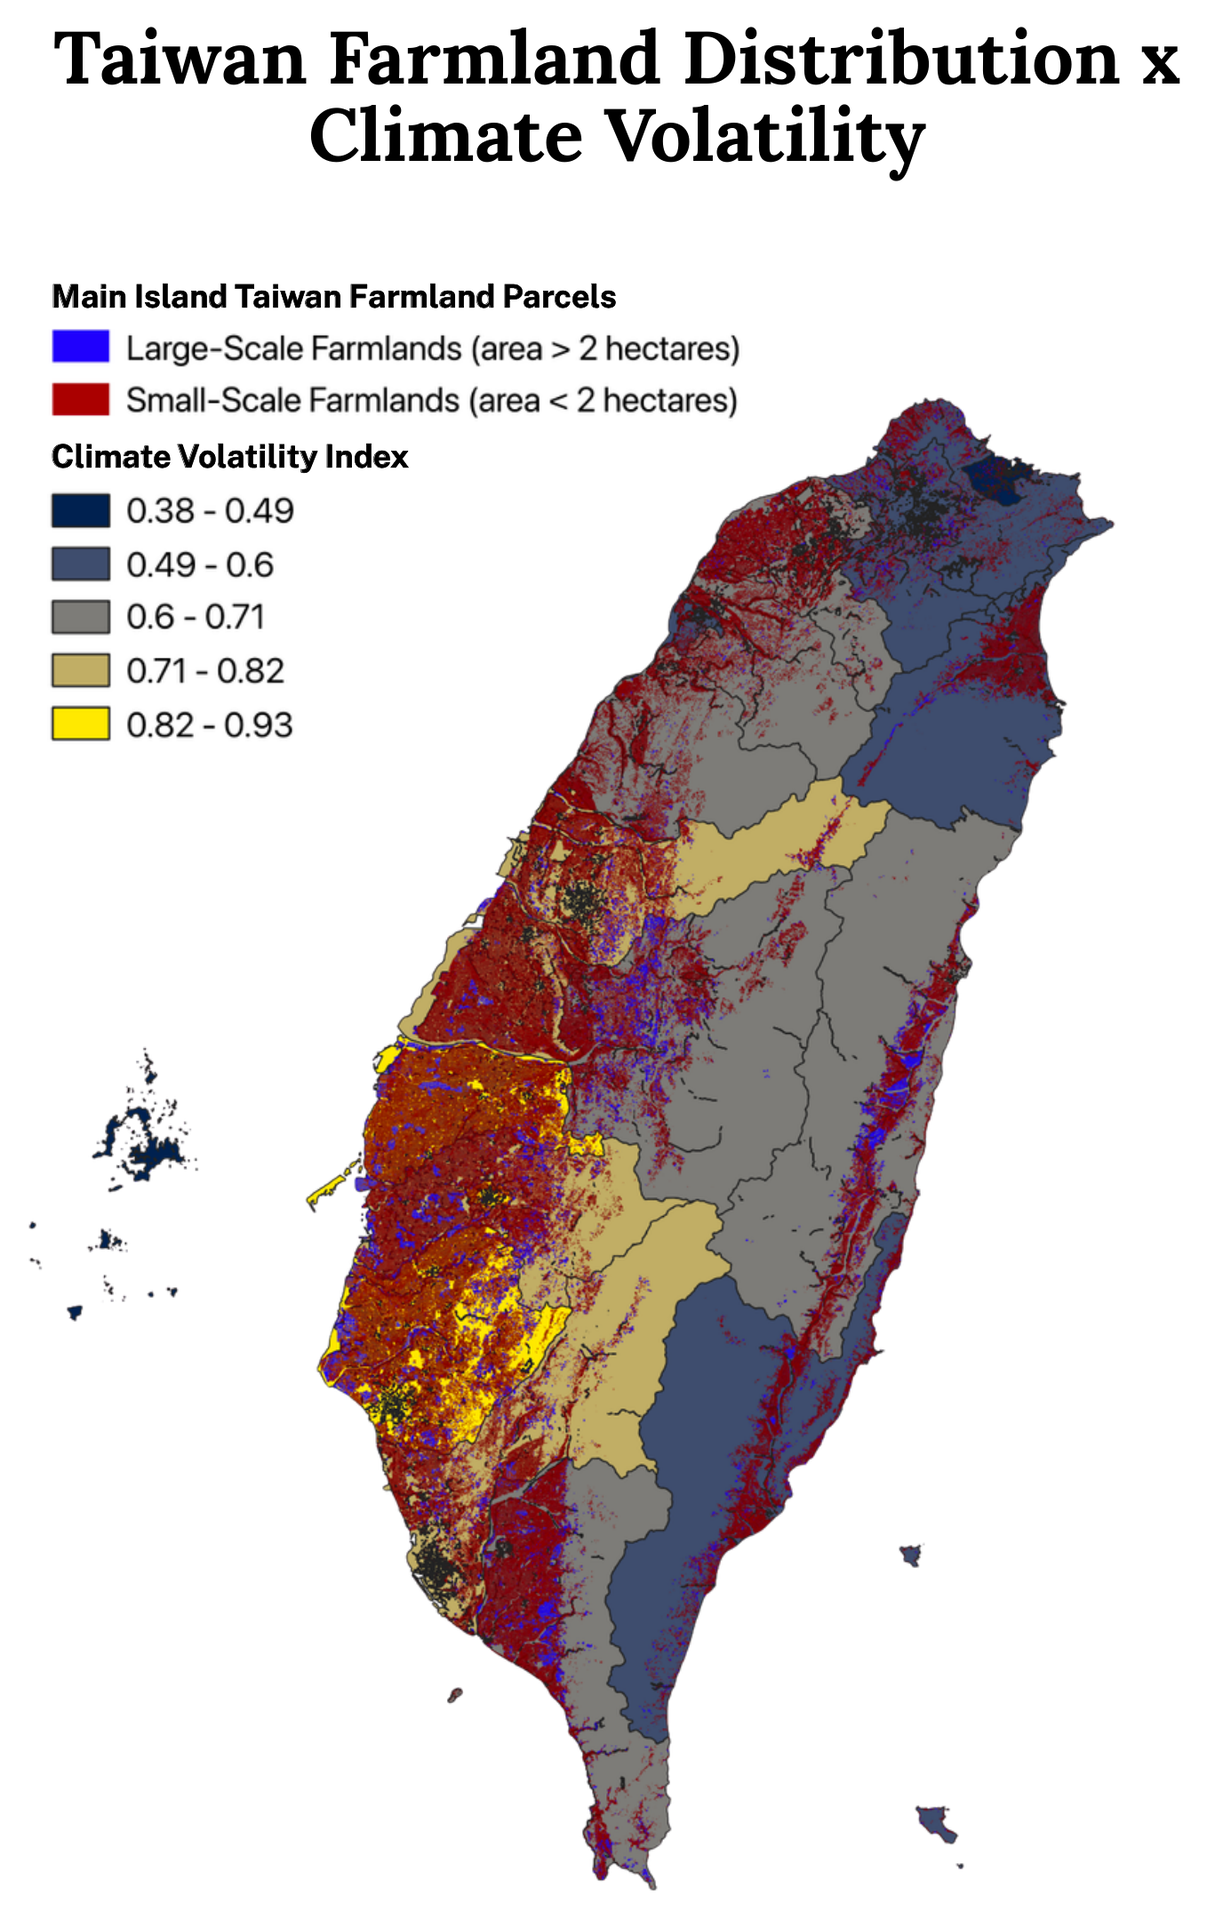
Portrait map of Taiwan titled Taiwan Farmland Distribution x Climate Volatility, with counties shaded by climate volatility index from dark blue at 0.38 to yellow at 0.93, overprinted with farmland parcels in red where under 2 hectares and blue where above. Red parcels dominate the western plain.
Figure 6. Taiwan Parcel Farmlands x Climate Volatility.

Figure 6 shapes the picture further. Small-scale farmland (red, under 2 hectares) clusters heavily along the western plain and southern regions – the same areas that overlap with higher climate volatility index bands. The farmers with the least land, the least capital buffer, and often the least physical capacity to adapt quickly are disproportionately the ones farming in Taiwan’s most volatile microclimates.

Centralized vs. decentralized agriculture

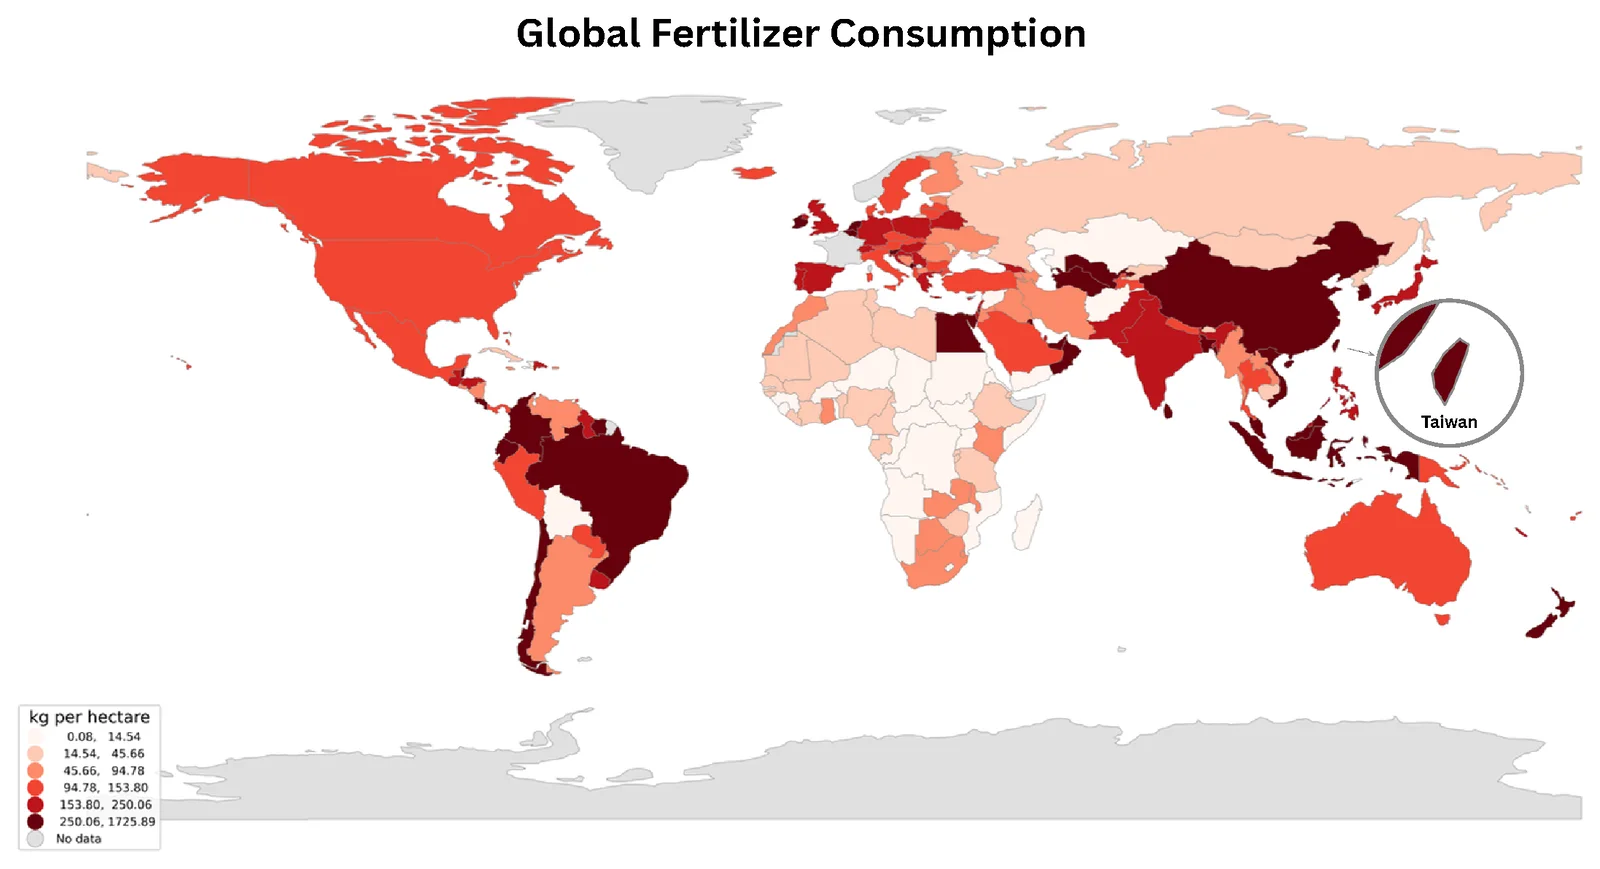
Taiwan, at just 36,200 square kilometers, consumes more than 300 kilograms of fertilizer per hectare – compared to roughly 128 kilograms per hectare in the United States, a country 9.83 million square kilometers in size. Part of this gap comes down to spatial pressure: only about a quarter of Taiwan’s land is viable for agriculture, versus roughly two-fifths in the US. But fertilizer use scaled to compensate for land scarcity comes at a cost. While fertilizer has propped up yields, excessive application strains underground soil biology and degrades soil quality over time.

Even against the world's most fertilizer-intensive economies, Taiwan sits in the highest consumption band. That's the signature of a uniform, centralized approach applied to conditions — recall the soil composition map above — that shifts from one soil type to the next within a matter of kilometers. A blanket fertilizer strategy is, by definition, poorly matched to a landscape this fragmented: it overcorrects in some regions and undershoots in others, because it was never built to respond to hyper-local variation in the first place.

World choropleth of fertilizer consumption in kilograms per hectare, pale pink to near-black, with an inset circle enlarging Taiwan in the darkest class alongside China, Japan and Malaysia.
Figure 8. Global Comparative Fertilizer Consumption (Unit: Kilograms per Hectare).
Figure 7. Taiwan’s Annual Fertilizer Consumption Breakdown
YearFertilizer applied (tonnes, product weight)Nutrient intensity (kg N+P+K/ha)Nitrogen (t)Phosphorus (t)Potassium (t)Value (NT$ million)
20111,105,732581179,56263,96898,53111,666
20121,111,123589182,41265,03999,58712,737
20131,048,134591177,57866,558104,12411,382
20141,075,700flagged†flagged†flagged†flagged†9,670
20151,001,517555169,20662,65495,17510,165
20161,009,286571171,89665,21099,0789,024
2017939,829531161,98860,23390,3118,840
2018955,406530159,47859,73792,8798,238
2019878,520flagged†flagged†55,95287,9527,969
2020926,444531158,33958,82595,7288,330
2021839,365474142,81852,33784,1717,480
2022818,736463138,47652,38582,0187,854
2023772,084441131,31050,09578,5287,581
2024800,434453134,36551,10181,3937,597
2025792,963449133,04150,74280,5867,994
Figure 7. Taiwan’s Annual Fertilizer Consumption Breakdown.

That centralization problem isn't just chemical — it's logistical. To quantify it, we built a nationwide GIS routing model connecting every one of Taiwan's 613 registered fertilizer companies to real farmland: 2,792,536 individual parcels, aggregated by township into 346 demand nodes covering roughly 743,500 hectares of arable land. Each company is routed only to farmland inside its own county, using live road-network distance rather than straight-line distance — the model won't let a company shortcut to a closer field across a county line, because that's not how actual distribution works.

Figure 9. Fertilizer and Agrochemical Footprint from Corporation to Farms. Open it full screen

Even under this best-case, same-county assumption, the model shows that centralized fertilizer production still has to travel: every kilogram makes a real trip along real roads before it reaches a real field, adding cost, time, and emissions that a farm averaging under 1.1 hectares absorbs disproportionately relative to its output. A production model that instead manufactures the protectant on-site — at the scale of a single farm or a shared township reactor — removes that shipping step entirely. There's no freight distance to close, because there's no freight.

Farmers have persevered so far by drawing on generations of accumulated, hyper-local expertise. But climate unpredictability has opened a gap between how fast that tradition can adapt and how fast the climate is now changing — and centralized, one-size-fits-all interventions, whether chemical or logistical, aren't built to close it.

Execution

Execution: GIS and Wet Lab

By incorporating GIS into ReLEAF—from LPA measurement and plant assays—the team is able to analyze lab-scale efficacy test results to quantify and predict real-field spatial deployment.

  1. Light Physical Activity

    In consideration to confirming and quantitatively measuring on-site on-demand deployment in fields, a highly important factor to consider is how well our engineered bacteria responds to light, how quickly is the response, and how much protectant is ultimately produced. The Light Physical Activity (LPA) allows for quantitative analysis and accurate measurement rather than blindly answering these concerns qualitatively.

    The LPA is a 24-tube LED array that holds engineered B. subtilis WB800 (CcaS/CcaR system) under six defined light conditions at once: green light (~535 nm) induces protectant production, and red light (~670 nm) halts it. Each condition is one column of four resistance-matched LEDs lighting four tubes. Intensity is set by Arduino PWM through three MOSFETs, one per tier (low, mid, high), and held constant for the whole run. Rather than a single endpoint reading, we sample each condition over time and track protectant output across the full period.

    What we are measuring:

    • Production Timeline
      • How long after induction the protectant becomes detectable, and how that timing shifts with light intensity (low, mid, high) and wavelength (green vs. red).
    • Total Yield
      • This depicts how much protectant a culture is able to produce under a given light threshold, the following allows for a direct comparison of the yields across varying light intensity conditions.

    The LED characterisation, build details, and results as they become available are documented on the LPA hardware page.

    Contribution to the math model

    The production rate from the LPA is a direct input to Stage 2 of the Math Modeling sector (DryLab × GIS). There, it converts specific enzyme activities into a volumetric production rate. That rate is what the model needs to calculate coverage radius, deployment density, and units per hectare. Production rate depends on the light regimen, so it is carried into the model as a range across conditions rather than a single value. This ties the light each unit receives in the field to how much protectant it delivers per hectare.

  2. Plant assays

    Functional assay validation

    Confirming the efficacy of ACCD is not equivalent nor similar to confirming that ACCD has reached the plant. The project is deemed useless if the protectant never reaches the root zone. Functional Assay Validations account for this flaw, it measures whether treated plants actually perform better under stress than untreated ones, using physiological readouts rather than assumptions. By evaluating these factors functional assay validation runs in four linked stages, each stage's output narrowing the confidence with which ACCD efficacy data can be used elsewhere in the pipeline:

    1. Physiological readout selection — chlorophyll a+b content as a quantifiable proxy for salt-stress damage
    2. Timing conditions — testing protectant delivery before, during, and after stress onset
    3. Salinity gradient — testing across 0, 75, and 100 mM NaCl to capture dose-dependent response
    4. Cross-system validation — repeating the same assay across agar, hydroponics, and soil to test whether efficacy holds as the growth environment moves from idealized to field-realistic

    Chlorophyll content as a physiological readout

    Chlorophyll degradation is one of the earliest and most reliable indicators of salt stress in plants. Sodium accumulation disrupts chloroplast structure, accelerates chlorophyll breakdown, and suppresses photosynthetic capacity well before visible wilting occurs. Thus, chlorophyll content serves as a quantitative proxy for stress damage, and by extension, for protectant efficacy. A plant that retains more chlorophyll under identical salt exposure is a plant that is better protected.

    We quantified chlorophyll a+b content spectrophotometrically, using absorbance readings at 645 nm and 663 nm following extraction in 80% acetone. Chlorophyll a+b content was quantified spectrophotometrically (OD645, OD663) following extraction in 80% acetone, using the standard formula

    \[ \text{Chl}_{a+b} = \frac{\big[\,8.02\,(OD_{663}-\text{Blank}_{663}) + 20.20\,(OD_{645}-\text{Blank}_{645})\,\big]\times V}{1000} \]

    Meanwhile the results were reported both as raw concentration and normalized against fresh tissue weight. The two factors were both recorded to avoid misinterpreting the result.

    Results

    Untreated controls showed low chlorophyll content across all salinity levels, which suggests baseline chlorophyll extraction or growth conditions in this experiment were conservative rather than optimal, a detail worth accounting for when comparing absolute values across experiments. Every ACCD-treated group, regardless of timing, showed higher chlorophyll retention than its corresponding control at matched salinity.

    Cross-system validation

    The chlorophyll data above was collected on agar, including a controlled environment isolating ACCD’s biological effect on its transport variability. While agar does establish its existence and effect, it does not confirm its effect in real root-zone or external delivery.

    SystemWhat it testsValidation Sector
    AgarDirect physiological effect, no transport confoundBaseline efficacy
    HydroponicsLiquid-phase delivery through root-zone waterTransport-dependent efficacy
    SoilAdsorption, degradation, heterogeneous flow through real soil matrixReal-field testing

From functional assay to GIS

Soil-validated efficacy data is what allows the five FVM soil-type coverage estimates covering the Math Modeling sector to be treated as measured results rather than untested projections. Without a plant-level confirmation that ACCD actually protects roots once delivered through soil rather than agar or liquid media, the coverage radius, deployment density, and unit-per-hectare figures downstream would all rest on a modeling assumption instead of a physiological result. This is the correlation between Wet Lab and GIS: the chlorophyll data is the evidence that the coverage radius GIS maps onto Taiwan's counties is protecting something real, something farmers can come to recognize as theirs.

Execution: GIS and Dry Lab

Deploying our bioreactor in the field starts with a question: how many units does a given plot of land actually need? Answering it requires two disciplines working in tandem — math modeling translates enzyme activity and wet lab production data into how far and how long the protectant remains effective in soil, while GIS maps those results onto Taiwan's real soil composition at the county and township level. Together, they turn a lab-scale production number into a concrete deployment count for every location.

Execution: GIS and Human Practices

The GIS page ends with a number: how many bioreactors a given township needs per hectare. Human Practices asks the four questions that decide whether that number ever becomes hardware standing in a field; is it legal, who holds the capital, what does it cost against what the crop is worth, and is it actually better than what the farmer does/ has today. Answering them requires two kinds of work in tandem: stakeholder engagement tells us what farmers, farmers' associations and forum audiences will and won't accept, while desk analysis of Taiwan's statutes, farm economics and the competing product landscape tells us what is permissible and affordable. Together they turn a deployment count into a deployable product.

  1. Business plan

    Ownership model. Applying unit cost (NT$30,000) to the deployment densities calculated above puts capital cost per hectare at or above one full year of gross paddy revenue in every soil type, while roughly five times annual revenue in sandy loam, the soil class this model flags as needing the most units. Since 99% of Taiwanese farmers work under 2 hectares, individual ownership is arithmetically out of reach for nearly the entire target sector. A shared-asset model through Taiwan's farmers' associations isn't a preference — it's the only ownership structure the numbers permit.

    Organic regulation. Taiwan's Organic Agriculture Promotion Act excludes any product of a genetically modified organism from certified organic production, regardless of containment. Because ACC deaminase is produced by an engineered strain, this excludes ReLEAF from organic and friendly-environment farming; about 3.7% of cultivated land, but a disproportionately significant one, since these are the fastest-growing segments in Taiwanese agriculture and the audience most predisposed to adopt a biological input. The addressable market is conventional agriculture, roughly 96% of cultivated land.

    Cost. Under the shared-ownership model, the number that matters to an individual farmer isn't capital cost, it's cost per hectare per season, drawn from an association-owned unit. That figure depends on refill cartridge cost and hardware service life, both still pending field data. The rice-straw-return mechanism is the key cost lever: farmers exchange straw waste for reduced-price protectant, lowering cost without a subsidy.

    Carbon footprint. On-site production removes most emissions tied to centralized supply — industrial synthesis, packaging, shipping, cold chain — but introduces continuous operational electricity and embodied hardware emissions in their place. Decentralization isn't automatically lower-carbon; it depends on duty cycle and grid intensity. A unit that only activates on a predicted stress event, rather than running continuously, making this trade-off favorable, as the same on-demand logic that makes deployment agronomically precise is what makes it carbon-competitive.

    Competitive position. Against centralized biostimulants, live engineered microbial inoculants, and conventional breeding for tolerance, ReLEAF's distinct position is delivering an engineered biological function to the root zone without releasing an engineered organism into the environment, while remaining adjustable within hours of a predicted stress event rather than committed at planting. The tradeoff is capital cost and continuous power draw, which is why the shared-ownership model above isn't incidental, it's load-bearing. The open competitive risk: a conventional biostimulant achieving a large share of the protective effect at a fraction of the capital cost may still be the rational choice for a farmer under seasonal cash constraints, and a direct effect-size comparison against those products is still outstanding.

Back to GIS

Derived from the math modeling indications, the soil type with the highest need is sandy loam, while it also is the coastal soil class this project's current geomorphology-based classification heuristic assigns most broadly. That means soil classification accuracy doesn't just affect the map; it determines whether the ownership model above is financially viable in a given township. This is the strongest argument for replacing the placeholder classification with parcel-resolved TARI soil survey data.

Validation

Problem validation

Through a public forum held with farmers across agricultural regions in Taiwan, namely Nantou, Hualien, Hsinchu, Yilan, etc.; we collected interview data from farmers planting various plants—like cocoa, rice, coffee beans, and mixed grains. Spanning across crops and farm scales, we identified a consistent pattern that has emerged within the last 5 years: soil management is conducted based on habit, as they perceive it as extra money spent on seemingly useless data.

“Not directly, farmers do not manage it [soil]”

Cocoa Farmer from Nantou

This statement demonstrates the evident validation of IHP, establishing the gap covering that the problems identified are not limited to rice cultivation, but relevant to all smallholder agriculture in Taiwan, relating to soil management.

Inconsistent soil testing

After visiting numerous booths, most of the interviewed farmers applied organic fertilizers based on a fixed annual schedule, not based on current soil deficiencies or environmental changes. At farms where soil testing does occur, it has a tendency to be limited in frequency: a mixed grain farmer in BaoZhong receives one free test from the government per year, and so do farmers in Miaoli; while they stated, in addition to the free one, they wouldn’t go out of their way and pay more for calculated numerics. Meanwhile, the cocoa farmer quoted above consults no expert whatsoever.

Contrastingly, there are notable exceptions as different farmers with varying crops tend to have different perspectives and priorities in order to maximise their yield, and what they value in; money, yield, the joy of it. For example, on the contradictory to people who don’t test, pear and peach growers from Hualien mandates soil testing and treats calcium deficiency as disqualifying for certification, while a persimmon farmer in Hsinchu independently targets a substrate pH of 5.6 to 6.2, having begun from an initial pH of 3. These two cases demonstrate that data-driven soil correction is effective when implemented, but they also represent exceptions rather than common practice. This finding indicates a gap that a passively deployed bioreactor is designed to address, as it delivers a corrective response without requiring the farmer to first acquire diagnostic capability that most currently lack and do not actively pursue.

Organic certification requirements constrain adoption

The Nantou farmer’s response to any proposed treatment was specific and immediate: a natural protectant would be acceptable, provided its compatibility with organic certification requirements could be confirmed. This farm is in the process of transitioning to certified organic status, and any input under consideration must remain compatible with that transition. This has direct implications for product positioning: a biological, non-synthetic treatment such as ACC-deaminase PGPR is not merely acceptable to this segment of farmers but may represent the only category of input such farmers are willing to consider. This also identifies a concrete requirement for market entry, as confirming compatibility with organic certification standards is not a clean line, rather a grey area, making farmers in their trial stage of the organic transition unwilling to risk it and try out the product.

Growing economic conditions motivate adoption and inheriting farms

Throughout the conversation of a Nantou farmer, they present a clear illustration and will for turning small farming into a business as time progresses. He expresses that the farm was originally cultivated solely to supply food to the farmer's family, with no intent towards expansion. This was until the responsibility of maintaining the growing land of previously owned aging parents, combined with the increasing food demand, prompted their agriculture to shift towards commercial production. They’ve established that the agricultural labor force is aging, as profit margins remain narrow with pest control left unattained, and the farmers are nonetheless actively working to establish a product following organic regulations. This represents the customer profile most relevant to IHP: small-scale farmers seeking to optimize profits while reducing manual labor.

Farmer’s Main CropFarmer LocationFarmer Location’s Average Temperature (ºC)
CacaoNantou24.3
Peaches and PearsHualien Zhonghe24.2
CacaoPingtung25.9
Coffee BeansGuanxi Mawudu24.5
Fruit TreesXingzhu24
Rice and FruitsYilan23.4
Mixed GrainsChiayi24.3
Fruit TreesMiaoli23.3
VegetablesHsinzhu24.5
Fruits & VegetableYilan and Taichung23.4 & 24.5

Impact

Current reach

Farmers have watched their irrigation wells grow saltier every season for two decades – the slow consequences of agriculture-driven land subsidence reshaping the region’s water table. Layered on top of that, a flowering-window heat spike that once was exceptional is now routine across southern Taiwan. Neither shows up as a single bad harvest. Together, they quietly tax yield season after season, and the farmer’s income along with it.

“In the past few years, our rice yield has gradually decreased to only or even less than ⅓ of the most optimal output”

Farmer from Yilan, northeastern Taiwan

This is the baseline ReLEAF is built against.

Dosed into the same irrigation cycle a farmer already runs, a ReLEAF bioreactor changes that arithmetic. ACC deaminase pretreatment measurably preserves chlorophyll content — and with it, photosynthetic capacity — under salt stress, holding onto 86.3% of unstressed performance at moderate salinity (~75 mM NaCl) and 25.3% at severe salinity (~100 mM NaCl), benchmarked against the literature-predicted loss curve for unprotected rice.3 The assay behind those numbers is documented in the Wet Lab section; here, we focus on what that protection is worth, and its impact.

Priced at the 2026 guaranteed paddy rate of NT$26/kg,4 the effect on profit is not incremental — it roughly doubles what the field nets. A moderately stressed hectare goes from about NT$60,996 in unprotected revenue to NT$122,782 protected, a net benefit of NT$61,786 per crop. Under severe stress, the gap narrows in absolute terms, but the multiple holds: NT$21,216 unprotected versus NT$49,396 protected, a NT$28,180 net benefit. On a double-cropped field, standard practice across much of this land, both figures roughly double again over a year.

There's a second, smaller lever alongside preserved yield: fertilizer. Taiwan already applies fertilizer at roughly 3.5× US intensity — 449 kg of N+P+K per hectare in 2025 versus about 128 kg/ha in the US7 — largely because only a quarter of Taiwan's land is arable, against roughly two-fifths in the US, so yield per hectare is pushed harder to compensate for scarce land. At NT$30.24 per kg of nutrient (from national 2025 fertilizer value and volume data8), that's about NT$13,578/ha/year in fertilizer spend. ACC-deaminase PGPR treatment has been shown, in a southern-Taiwan field trial on rice under alternate wetting-and-drying cultivation, to sustain yield at 25% less chemical fertilizer.9 Applied here, that's roughly NT$3,395/ha/year saved on fertilizer purchase — folded into the payback figures below. The matching transport and footprint savings are real but marginal: Taiwan's fertilizer retailers already sit a median 0.4 km from the farmland they serve,10 so 25% less fertilizer moved works out to roughly NT$2/ha/year in avoided freight and 0.03 kg CO₂/ha/year — a rounding error next to the purchase savings, not a second driver of payback.

Whether that combined profit outruns the upfront cost comes down entirely to soil type, since bioreactor density is set by how far the protectant disperses through each soil's pore structure — the same FVM coverage model behind the deployment map. At a fixed NT$30,000 per unit, clay soils need only 10 units/ha and break even in about 4.6 years under moderate stress; sandy loam needs 50 units/ha for the same coverage and takes 23.0 years. The chart below plots cumulative cash flow for all five soil types side by side, with each line's break-even point marked where it crosses NT$0. The pattern is worth sitting with: sandy loam is both the coastal, most salt-exposed soil type and the slowest of the five to pay back — the land that needs protection most is also the most capital-intensive to protect it. Loam, Inceptisol, and Alfisol, more typical of Taiwan's interior plains, recover their investment in roughly 7 to 10 years. Every number above assumes a single crop per year; double-cropping roughly halves each payback period shown.

Future prospect

Figure 10. Farm Calculator: What ReLEAF Means For Your Field. Open it full screen

Contribution and tools

Guide

This guide is for teams new to GIS, as this tutorial covers 2 core fundamentals; switching between raster and vector data, and how to import data through three main data formats commonly accepted by GIS; GeoJSON, CSV, and Shapefiles (.shp). If the researched data sets are not in these three formats (eg., tables), or contain variances among the data (eg., different coordinate systems, unwanted data), you can reference the LLM broad prompt below providing high efficiency when dealing with these issues.

To allow non-professionals or people interested in utilizing geospatial analysis/ GIS in their projects, we put together a practical guide covering how to distinguish and navigate through raster vs. vector data, additionally, how to import the three files into the aforementioned formats.

Rasters vs. vectors

As previously mentioned, Raster data and vector data are the most common and fundamental data types utilized within QGIS, one covering pixels, and the other utilizing lines/ points. Raster data sets are discrete and continuous cells (pixels) that represent data that gradually varies across space, also classifying them into different categories. Oftentimes, Raster data is used to present temperature or elevation maps as they can be visualized as continuous and gradient-like. Opposingly, Vector data are scalable values that only depict discrete features like data points or lines; it is most commonly used to establish borders or outlines of files.

Importing CSV files

  • CSVs are the most common way to present data (eg., farm locations, sensor readings)
    • Has to include longitude and latitude within the 2 separate columns
    • Can only be imported to GIS through delimited text file
      • Unable to be picked directly from the browser window
    • Make sure to clearly define the Coordinate Reference System (CRS)
      • (eg., EPSG:4326 / WGS 84)

Importing GeoJSON

  • GeoJSON is a readable format for vector types, commonly found for web-based mapping
  • Import directly via Layer → Add Layer → Add Vector Layer, or by dragging the file into the Layers panel.
  • GeoJSON typically embeds its CRS in the file itself, but confirm it matches your project CRS before combining it with other layers
    • mismatches here cause layers to silently misalign rather than error out.

Importing shapefiles (.shp)

  • Shapefiles are the standard vector format
    • Can be easily imported by finding the file within the Browser tab, and dragging the following onto the Layers tab.

LLM broad prompt

When researching global geospatial data, running into data sets with hundreds to thousands of numerics is inevitable. Oftentimes, these data sets are unorganized and condensed with tons of information often deemed too complicated for QGIS to directly utilize. Moreover with varying coordinate systems, data from different sources may have varying coordinates, unaligning in the software. Manually reconstructing thousands of numerics is time-consuming and could contain operator error, especially for students unfamiliar or non-professionals of the GIS field.

To address the following, we developed a broad, reusable prompt that generates data files in formats that QGIS is able to properly analyze (GeoJSON, CSV, SHP) from arbitrary raw input data. The following prompt, rather than being hard-wired to only analyze data sets beneficial to our project (Taiwan Farmland and Climate Volatility), the prompt is generalized so that any team desirable of use Geospatial Analyses can adapt it to develop their own geographic data set.

We designed the following prompt as a contribution other future iGEM teams can utilize and incorporate into their own project. As aforementioned, when integrating spatial analysis into desired projects, regardless of the specific data sets, it is bound to run into similar data overload problems, utilizing this prompt allows for easier data organization experiences.

The prompt mainly consists of the following components:

  • Takes numerous complicated or inconsistent data sets and formats them as GIS-readable data
  • Locates and extracts existing coordinate fields (latitude/longitude, X/Y, or combined location fields) from the raw data, even when inconsistently labeled
  • Detects or infers the coordinate reference system (CRS) of the source data and states it explicitly before proceeding
  • Standardizes the coordinate system to the convention required by the destination software (e.g., WGS84/EPSG:4326 for GeoJSON, valid geometry types, .prj requirements for shapefiles)
  • Outputs a clean CSV, SHP, or GeoJSON file with consistent columns, ready to import directly into GIS software (QGIS)

Rules that the prompt follows

  • Only utilizes data provided; extracting or reformatting an existing coordinate (splitting a combined field, converting units, reprojecting a stated CRS) is allowed, but it never invents, estimates, or geocodes a coordinate or value that isn't derivable from the file itself
  • If a coordinate's CRS is not stated and cannot be reasonably inferred, it says so explicitly and asks rather than defaulting to an assumption
  • If the data set contains empty or ambiguous data, it flags this explicitly rather than filling it in or leaving it silently blank
  • If fulfilling the author's request requires calculations (distance, filter, percentages), the logic is transparently shown, not just the final result
  • If a coordinate or value looks unusable (out of valid range, inconsistent format, mismatched CRS across records), it flags this before using it
  • The output format is exactly what the author requests (GeoJSON, SHP, CSV), with the CRS of the output stated explicitly

Our prompt's rules are grounded in established prompt engineering research rather than built ad hoc. Restricting the model to only use provided data reflects grounding research, shown to reduce hallucination (Addlesee, 2024). Flagging missing, ambiguous, or unusable values instead of guessing reflects calibration and abstention research, addressing a known tendency of LLMs to answer confidently rather than admit uncertainty. Requiring transparent calculation logic follows chain-of-thought prompting, shown to improve accuracy on multi-step tasks (Wei et al., 2022). Detecting and stating the coordinate reference system before use follows self-verification prompting, where an assumption is externalized so it can be checked rather than embedded silently in the output. Finally, requiring the output to exactly match the requested format (CSV, SHP, or GeoJSON) reflects structured output practices common to established frameworks such as CO-STAR and RTF, which produce more consistent, usable results than open-ended formatting instructions.

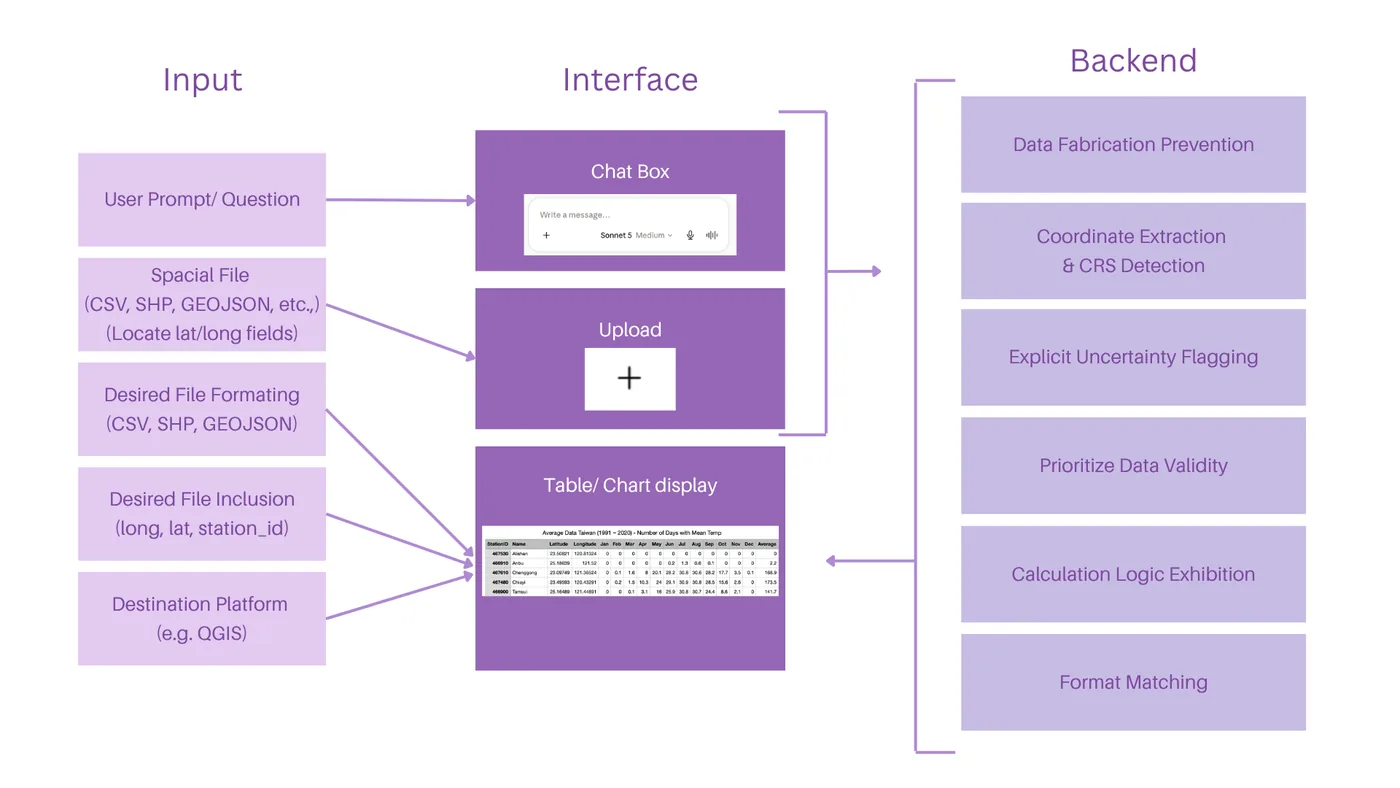
Depicted within Figure 11, the system architecture is organized into three interconnected layers: Input, Interface, and Backend, collectively supporting the operational deployment of the broad prompt.

Diagram in three columns. Input: user prompt or question, spatial file (CSV, SHP, GeoJSON), desired file formatting, desired file inclusion, destination platform. Interface: chat box, upload, table or chart display. Backend: data fabrication prevention, coordinate extraction and CRS detection, explicit uncertainty flagging, prioritize data validity, calculation logic exhibition, format matching.
Figure 11. System Architecture and Implementation Layers of the Broad Prompt.
Text 1. Sample of the broad prompt
I'm working with spatial data that I need prepared for use in QGIS.

Current data format: [CSV / GeoJSON / Shapefile]
Desired fields in output: [e.g. site_id, latitude, longitude, organism, soil_type, ph, collection_date]
Desired output format: [CSV / GeoJSON / .shp]
Destination: This output will be loaded directly into QGIS for spatial analysis.
My question: [e.g. "convert this into a clean GeoJSON with only the fields I need"]

Step 1 — Locate the coordinates.
Before answering my question, find the fields in my data that represent location
(e.g. latitude/longitude, lat/lon, X/Y, easting/northing, or a combined
"coordinates" field). Tell me which columns you identified and what you believe
their coordinate reference system (CRS) is, based on the values and any metadata
in the file (e.g. values in the range -180 to 180 / -90 to 90 suggest WGS84;
large 6-7 digit values suggest a projected CRS like UTM). If the CRS is not
stated and cannot be reasonably inferred, say so explicitly and ask me rather
than assuming WGS84 by default.

Step 2 — Prepare for QGIS.
- Reproject/report coordinates so the final output is usable in QGIS. For
  GeoJSON, use WGS84 (EPSG:4326) with [longitude, latitude] order, per spec.
- If the source data is already in a projected CRS and I haven't asked for
  reprojection, keep the original values but state the CRS explicitly in your
  answer so it can be set correctly in QGIS.
- For shapefile output, note that a .prj file defining the CRS is required —
  tell me what it should contain.

Rules for your answer:
1. Only use values that are actually present in the file. Extracting or
   reformatting an existing coordinate (splitting a combined field, converting
   units, reprojecting a stated CRS) is allowed and expected. Inventing,
   estimating, or geocoding a coordinate that is not derivable from the file's
   own data is not allowed — flag those records as "missing coordinates" instead.
2. If a field is missing, empty, or ambiguous for a record, say so explicitly
   rather than guessing — flag it as "uncertain" rather than filling it in.
3. If my question requires a calculation (distance, area, count, filter), show
   your work or the logic you used, not just the final number.
4. If a coordinate or value looks unusable (out of valid range, inconsistent
   format, mismatched CRS across rows), point it out before using it.
5. Give me output in exactly the format I requested, ready to copy or download,
   and state the CRS of that output explicitly in your reply.

Validation

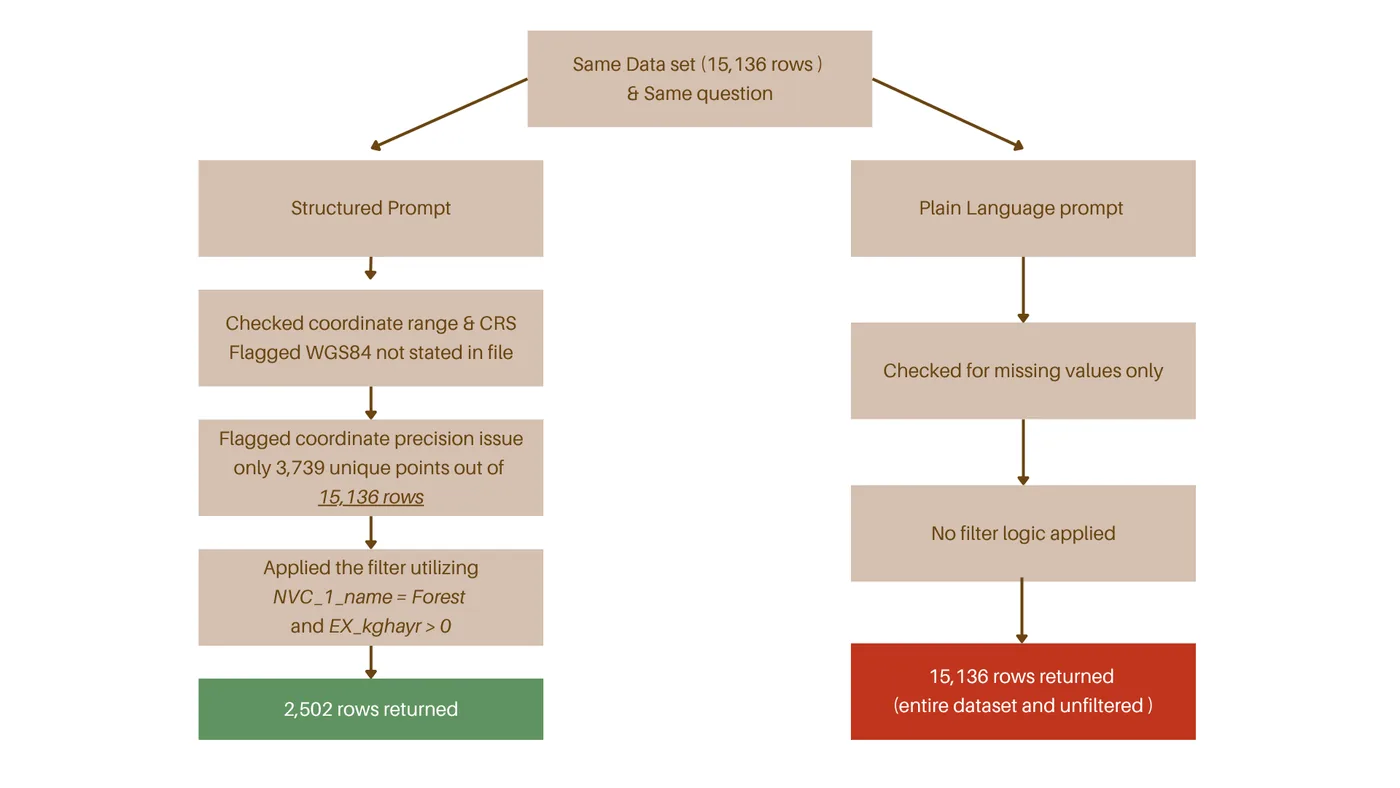
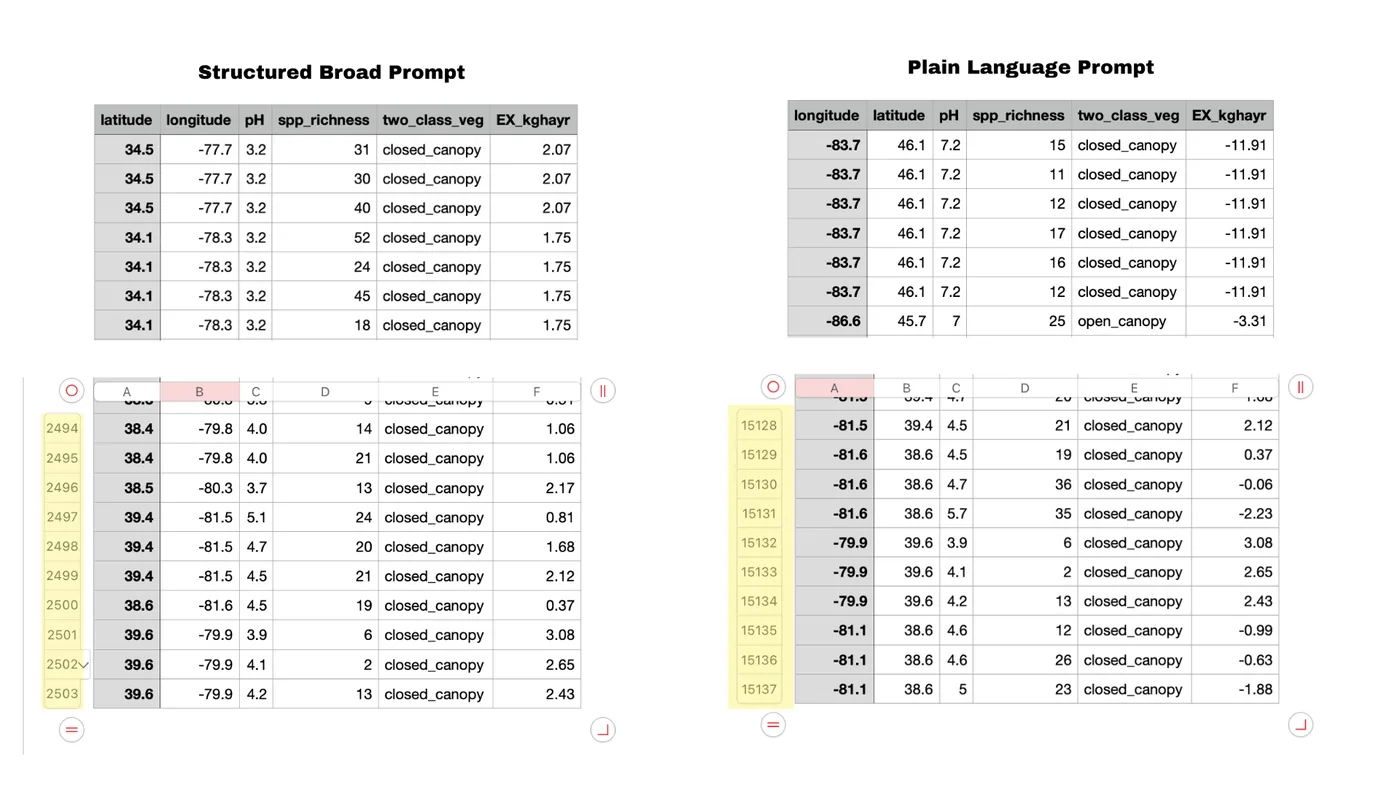
Flow chart. The same data set of 15,138 rows and the same question go to a structured prompt and to a plain-language prompt. The structured prompt checks coordinate range and CRS, flags a coordinate precision issue (only 3,739 unique points), applies the filter and returns 2,502 rows. The plain-language prompt only checks for missing values, applies no filter and returns all 15,138 rows.
Two spreadsheet excerpts side by side, headed Structured Broad Prompt and Plain Language Prompt, with columns latitude, longitude, pH, app richness, two-class vegetation and EX kg/ha.

References