Our optogenetic system depends on light intensity and wavelength. We therefore built the Light Plate Apparatus to expose multiple samples to defined red and green light conditions while minimizing variation between wells.
Intensity is controlled through pulse‑width modulation from an Arduino, with one MOSFET assigned to each intensity tier. Once a condition is set, the output remains fixed throughout the run so the LPA provides repeatable illumination rather than adjusting light dynamically.
The array itself, six columns of four with the MOSFET that drives each pair, is drawn in 4.2 Light Layout.
Engineering Cycles
Three design–build–test–learn cycles, from the first array on a breadboard to the enclosed, software‑controlled instrument. The three prototypes follow in order.
DBTL cycle 1 of 3
2.1 DBTL Cycle 1 – Dual‑Wavelength Array
One green and one red LED per column
Design
Each column carries a green and a red LED, so the wavelength can be switched quickly to exercise on and off control of protectant production. Nothing is calibrated at this stage: the aim was to confirm that the array drives both channels under software control.
Build
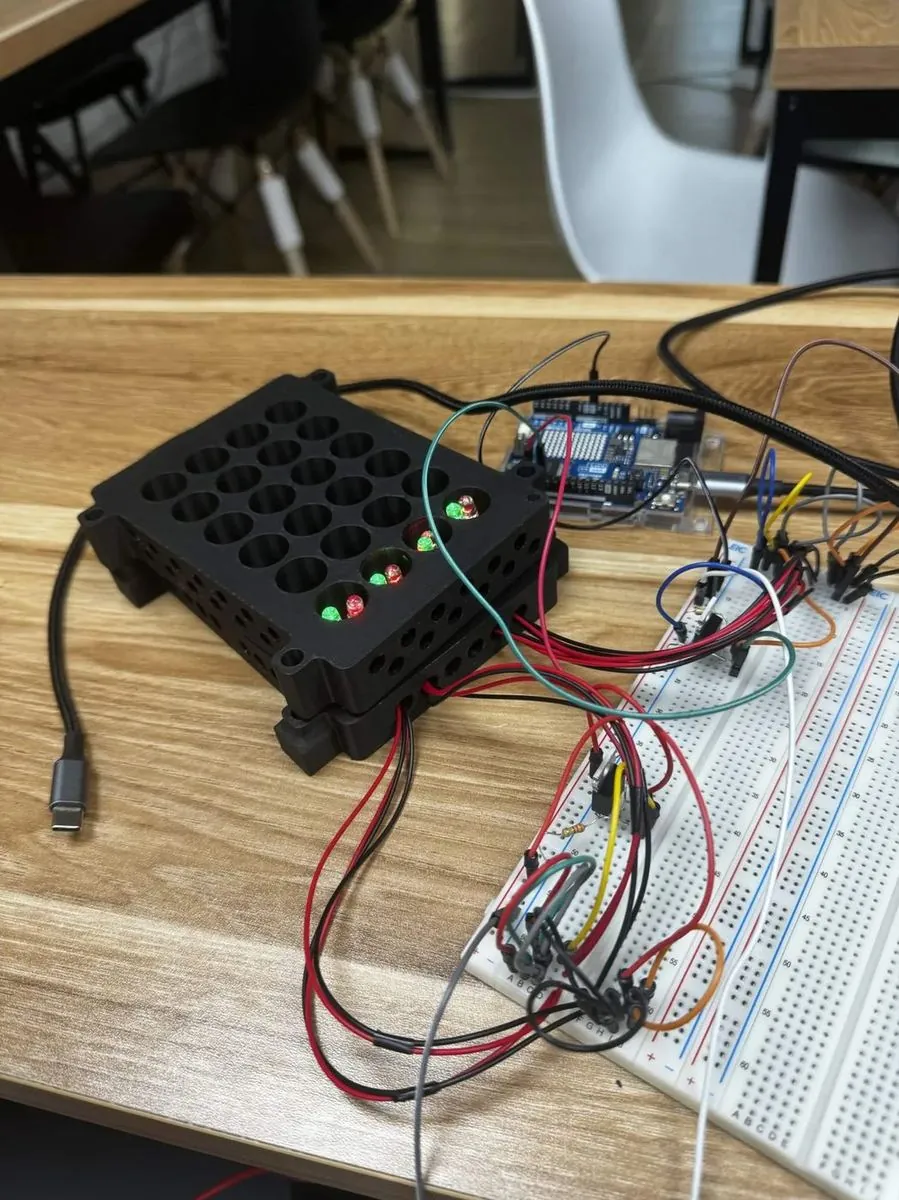
Each column carries a dual LED, so its output can be switched from green to red. Wire‑management prints were included from the start, since the harness is otherwise difficult to route at this density.
Test
The first dual‑wavelength array powered up and both LED channels switched on and off under software control. The light output was inconsistent across wells, which matters because an intensity comparison needs equal output within a condition.
Learn
The first prototype confirmed that the dual‑wavelength concept was feasible, but it also revealed a source of variation that had to be addressed before the light conditions could be compared reliably.
LED output was inconsistent
Individual LEDs in different wells produced different light intensities even when driven at the same setting. This meant that our low, mid, and high intensity levels were not yet consistent across the array, making comparisons between conditions unreliable.
DBTL cycle 2 of 3
2.2 DBTL Cycle 2 – Matched Output
Every LED measured, matched in fours
Design
Prototype 2 addressed the variation between wells. We measured every LED individually and grouped LEDs of similar output into matched sets.
Build
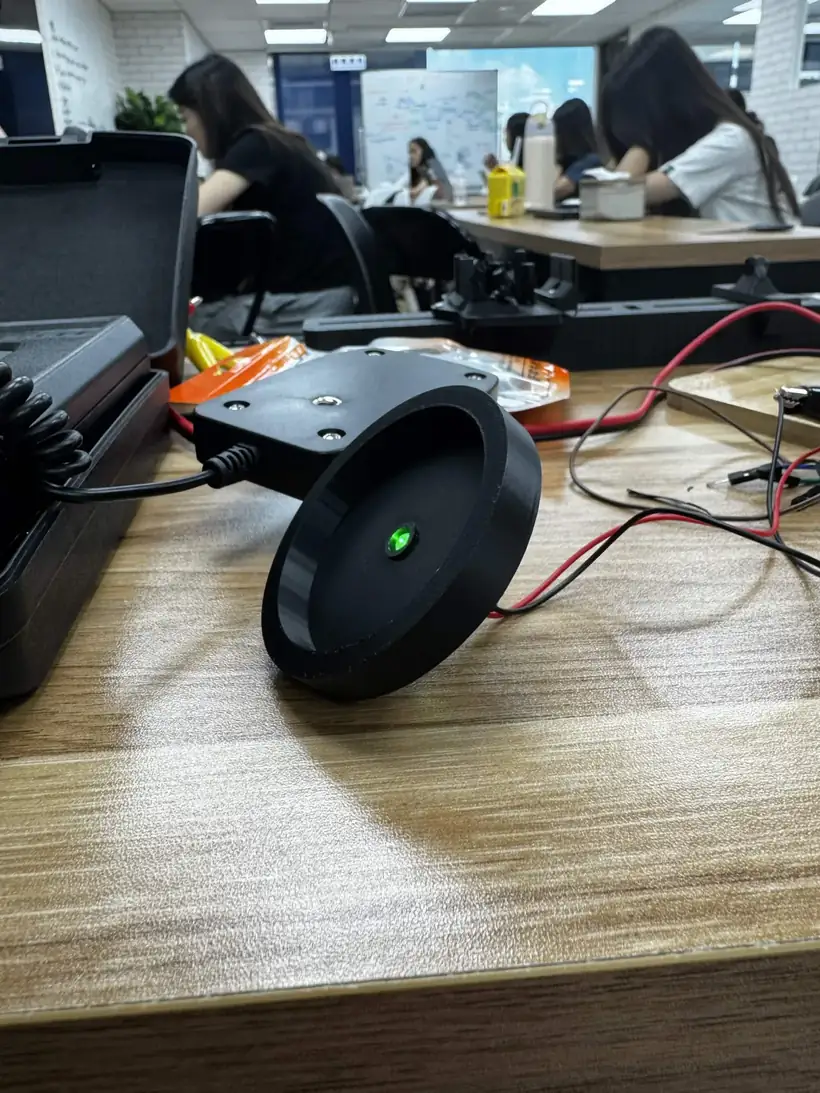
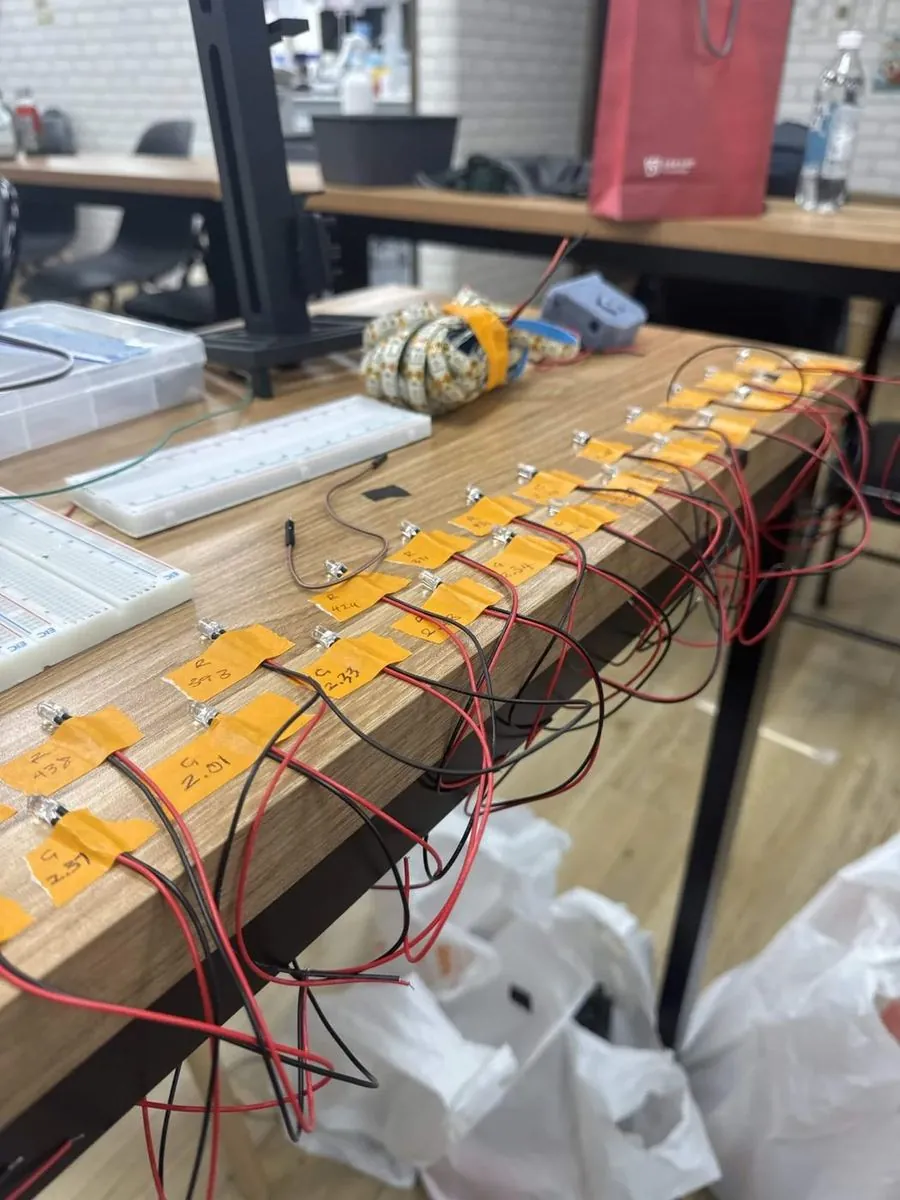
Every LED was driven at 5 V and measured individually on a light meter in a printed sensor fixture, so each reading was taken at the same distance and orientation.
Test
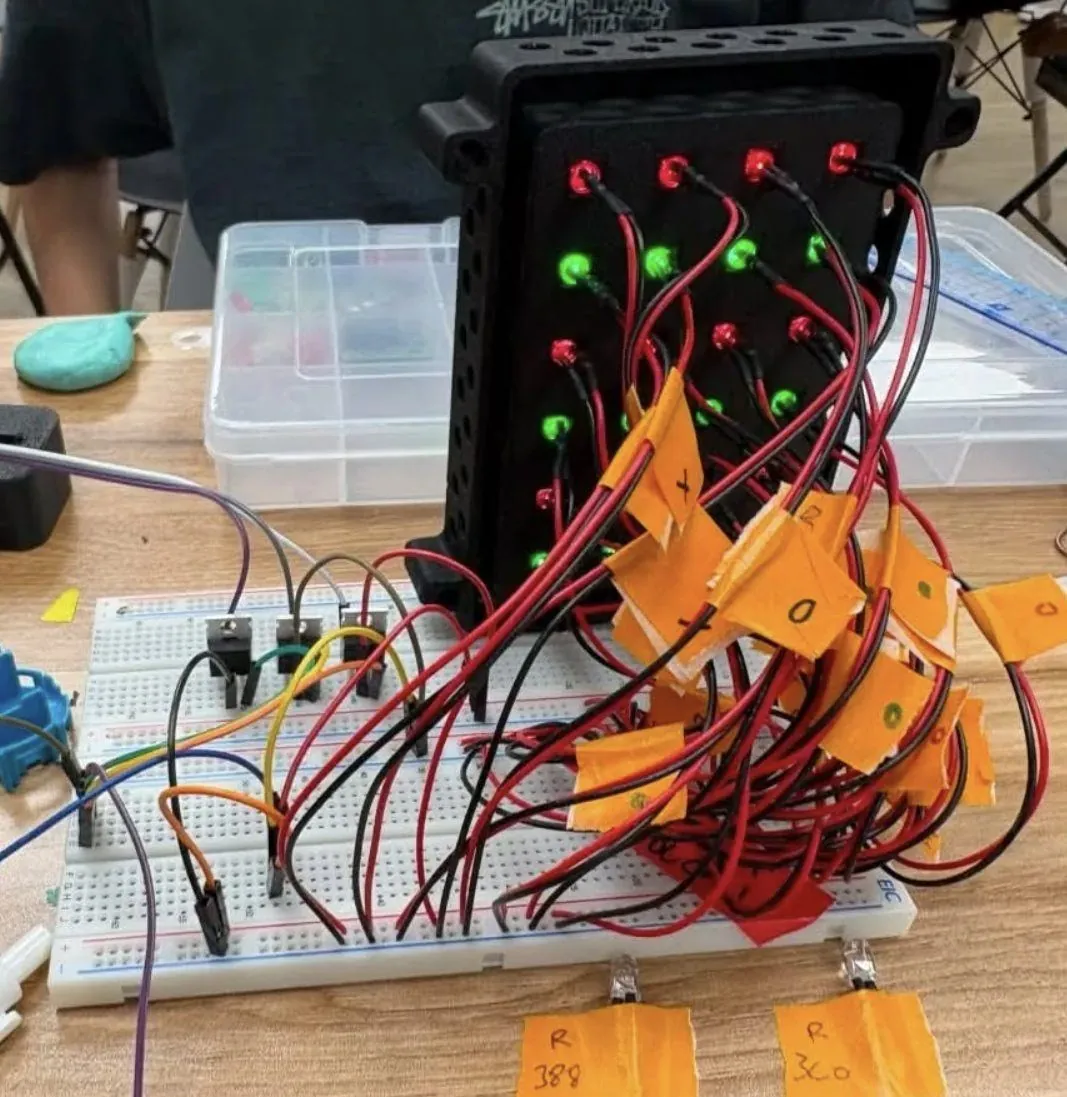
We measured all 20 green LEDs and all 20 red LEDs individually at 5 V, then sorted them into matched groups of four based on output. After rewiring, the six channels formed the low, mid, and high conditions for each wavelength.
| Row | 1 | 2 | 3 | 4 | 5 |
|---|---|---|---|---|---|
| A | 2.54 | 2.19 | 2.33 (low) | 2.40 (high) | 2.40 (high) |
| B | 2.37 (mid) | 2.11 | 2.34 (low) | 2.48 | 2.33 (low) |
| C | 2.01 | 2.37 (mid) | 2.38 (high) | 2.42 (high) | 2.36 (mid) |
| D | 2.33 (low) | 2.05 | 2.35 (mid) | 2.45 | 2.20 |
| Row | 1 | 2 | 3 | 4 | 5 |
|---|---|---|---|---|---|
| A | 431 (high) | 371 | 424 (high) | 393 (low) | 438 |
| B | 400 | 380 | 430 (high) | 397 (low) | 360 |
| C | 410 (mid) | 410 (mid) | 360 | 416 (mid) | 397 (low) |
| D | 411 (mid) | 390 (low) | 360 | 388 | 428 (high) |
| Green low | Red low | Green mid | Red mid | Green high | Red high |
|---|---|---|---|---|---|
| 2.33 | 0.390 | 2.35 | 0.410 | 2.38 | 0.424 |
| 2.33 | 0.393 | 2.36 | 0.410 | 2.40 | 0.428 |
| 2.33 | 0.397 | 2.37 | 0.411 | 2.40 | 0.430 |
| 2.34 | 0.397 | 2.37 | 0.416 | 2.42 | 0.431 |
Learn
Matching reduced the variation within each group. Before sorting, the green LEDs varied by 26% and the red by 22%; after matching, the four LEDs within each group differed by about 0.4–1.7% for green and 1.5–1.8% for red.
This showed that LED matching should be used to make each column internally consistent, while the actual low, mid, and high intensity levels should be set through PWM duty cycle rather than LED selection.
Prototype 2 left three limitations: the electronics were exposed, the intensity settings were adjusted by hand, and the culture tubes had no fixed position relative to their LEDs.
DBTL cycle 3 of 3
2.3 DBTL Cycle 3 – Enclosed Software‑Controlled Instrument
Enclosed, with intensity set in code
Design
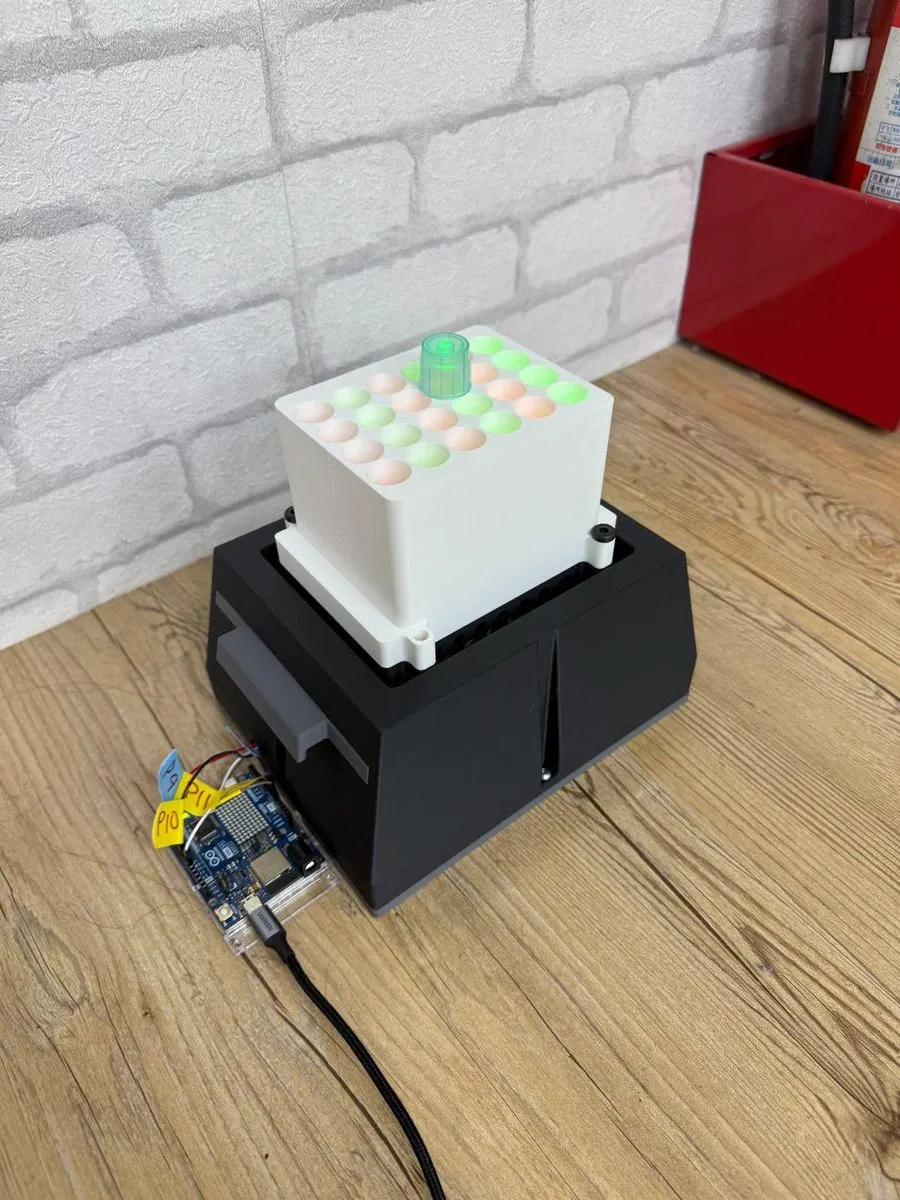
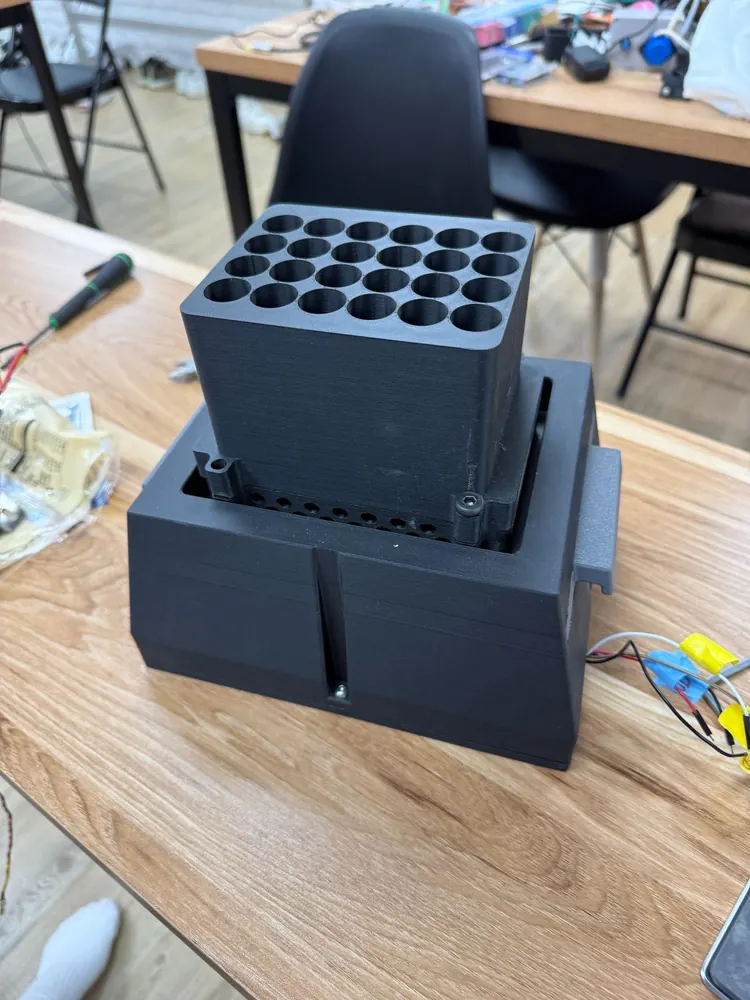
Prototype 3 kept the matched LED groups from Prototype 2, but focused on making the LPA easier to operate and reproduce through four key changes.
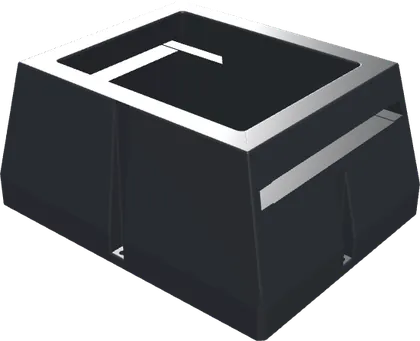 01 · LPA_Box
Enclosed electronicsA printed outer frame houses the LED wiring and perf board so the electronics are protected and contained.
Intensity in softwareLow, mid, and high light levels are set through PWM values in code rather than by manual adjustment.
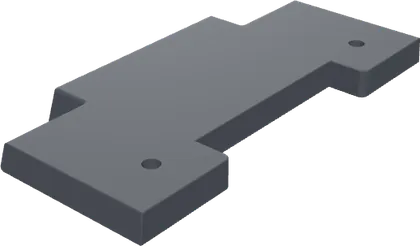
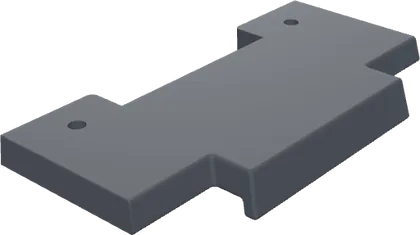 03 · Left_C, Right_C
Tool‑free assemblyPrinted slider components allow the LPA to be assembled and disassembled without tools.
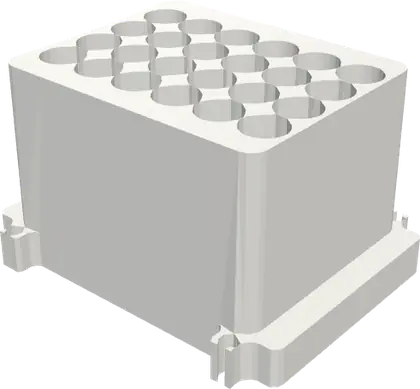 04 · Tube_Holder
Fixed tube position and light shieldingThe tube holder keeps each culture at the same distance from its LED, improving repeatability between runs, and covers the tubes from ambient light, so the effect of the green and red light is isolated and the data can be relied on.
Build
Test
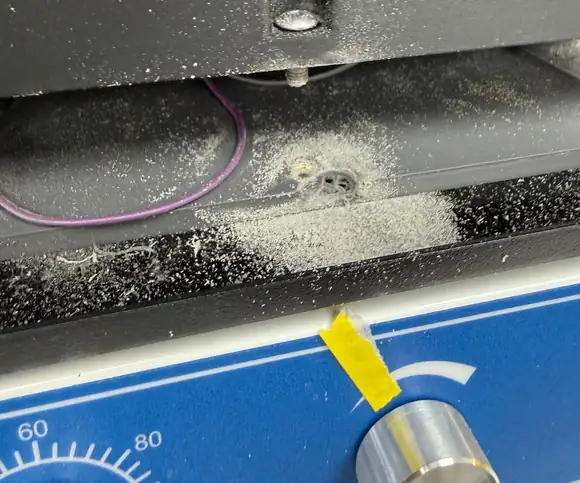
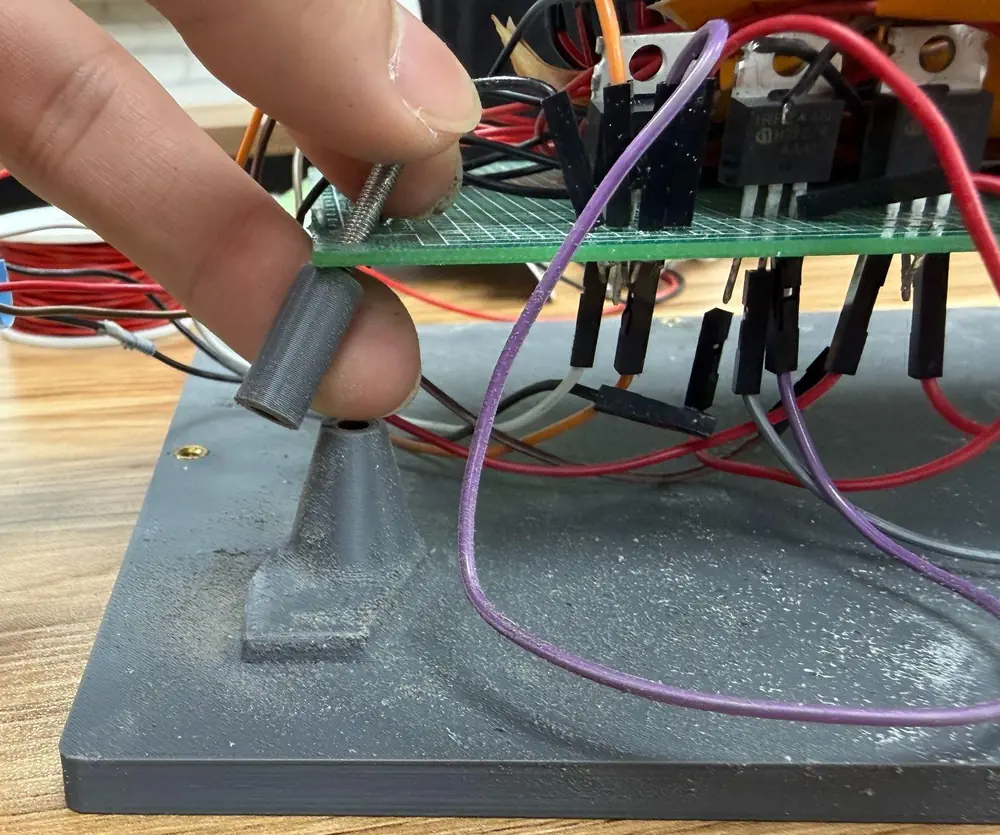
During the overnight shaker test one of the printed connection posts on the bottom plate broke off, and several wires came loose and were resoldered.
Learn
Reinforce the base at four points
The overnight run showed that concentrating the load on two mounting points was not mechanically sufficient, so all four screw positions on the bottom plate were used and the joints reinforced.
Block light between neighboring wells
The white tube holder allowed light to scatter into adjacent wells, so it was replaced with a black holder and the wall thickness increased from 2 loops to 4.
Results
3.1 First Culture Run, 19 September 2026
On its first culture run, the LPA grew B. subtilis WB800 under all six light arms to an OD600 of 0.91–1.01 at 24 h, close to the fitted plateau of 1.005.
The Run
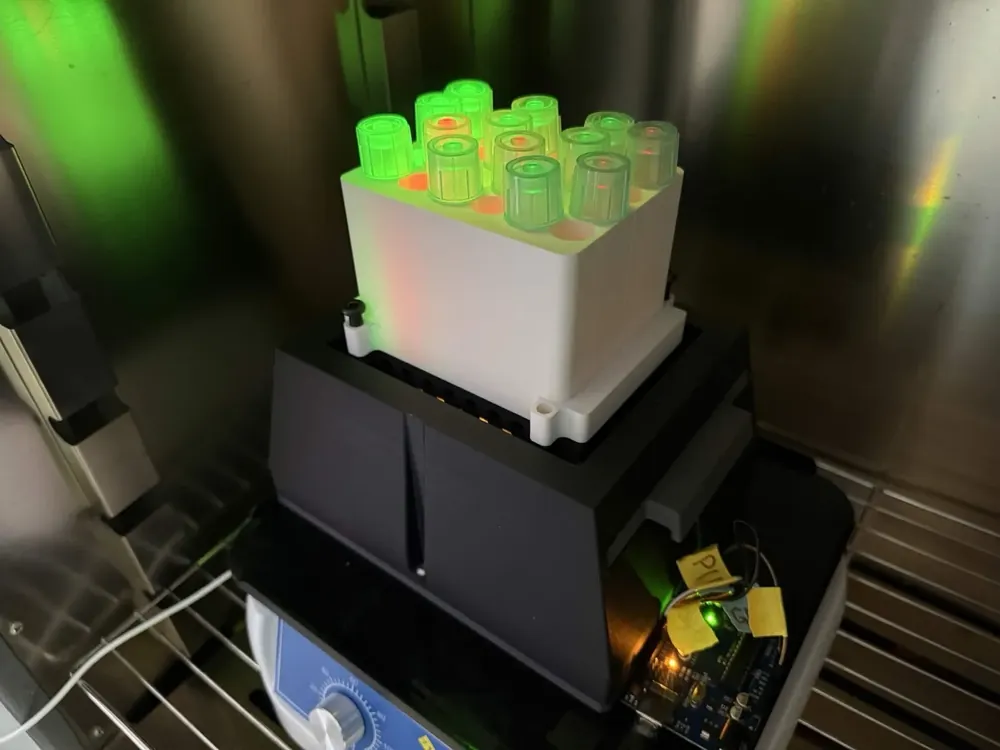
On 19 September 2026, B. subtilis WB800 grew in the LPA under its six light arms, red and green each at a low, medium and high intensity (R1–R3 and G1–G3), and was read on a plate reader at five time points up to 24 hours.
Twelve of the 24 wells were loaded: one tube in each red arm and three in each green arm; the other wells stayed empty. By the procedure on the team wiki’s Measurement page, each tube held 2 mL of LB inoculated with the culture and was incubated at 37 °C with shaking; the Digital Twin page notes that the plate’s temperature was not recorded during the run.
This is the overnight shaker run of prototype 3 (2.3): a bottom‑plate post snapped and light leaked through the white tube holder into neighboring wells, so the arms cannot be compared with each other.
| Arm | Light | Observed OD600 at 24 h |
|---|---|---|
| R1 | Red, low | 0.967 |
| R2 | Red, medium | 0.910 |
| R3 | Red, high | 0.967 |
| G1 | Green, low | 1.014 |
| G2 | Green, medium | 0.975 |
| G3 | Green, high | 0.958 |
The Growth Fit
A logistic model fitted the pooled readings better than a logistic with a lag phase (by AICc), with r = 0.299 ± 0.017 h−1 (a doubling time of 139 min) and a ceiling K = 1.005, at an NRMSE of 1.9% and R² 0.997.
The chart is drawn by script; its readings are in the table under it.
The readings behind the chartOD600, background subtracted, by arm and time
| Time | R1red, low | R2red, medium | R3red, high | G1green, low | G2green, medium | G3green, high |
|---|---|---|---|---|---|---|
| 2 h | 0.047 | 0.047 | 0.042 | 0.057, 0.028, 0.050 | 0.048, 0.054, 0.048 | 0.045, 0.047, 0.042 |
| 4 h | 0.056 | 0.055 | 0.061 | 0.063, 0.064, 0.060 | 0.064, 0.090, 0.067 | 0.062, 0.060, 0.061 |
| 6 h | 0.129 | 0.135 | 0.142 | 0.353× (excluded), 0.324× (excluded), 0.136 | 0.226× (excluded), 0.136, 0.149 | 0.236× (excluded), 0.129, 0.150 |
| 8 h | 0.192 | 0.185 | 0.197 | 0.234, 0.178, 0.191 | 0.231, 0.225, 0.200 | 0.210, 0.221, 0.210 |
| 24 h | 0.967 | 0.910 | 0.967 | 0.997, 1.024, 1.022 | 1.000, 0.949, 0.977 | 0.941, 0.961, 0.972 |
One tube per red arm and three per green arm, in tube order; × marks the four 6 h readings excluded from the fit. Readings from the team wiki’s Measurement page, less the blank its Digital Twin figure subtracts (0.061 at 2 h, 0.059 after); the fit and its band from the Digital Twin page.
The team’s digital twin uses this fit as its growth prior. Leaving each arm out in turn and forecasting its 24 h OD600 from the first eight hours, the error was at most 7% with the prior and 29 to 68% without it (Digital Twin page).
Final Design & Specifications
The final LPA combines what the three cycles established: LEDs matched by measured output, intensity set by PWM in code, enclosed electronics, a fixed tube position and a black holder that shields each well.
It lights 24 cultures under six fixed conditions, two wavelengths at three intensities with four replicates each, from one Arduino and three MOSFETs.
4.1 Specifications
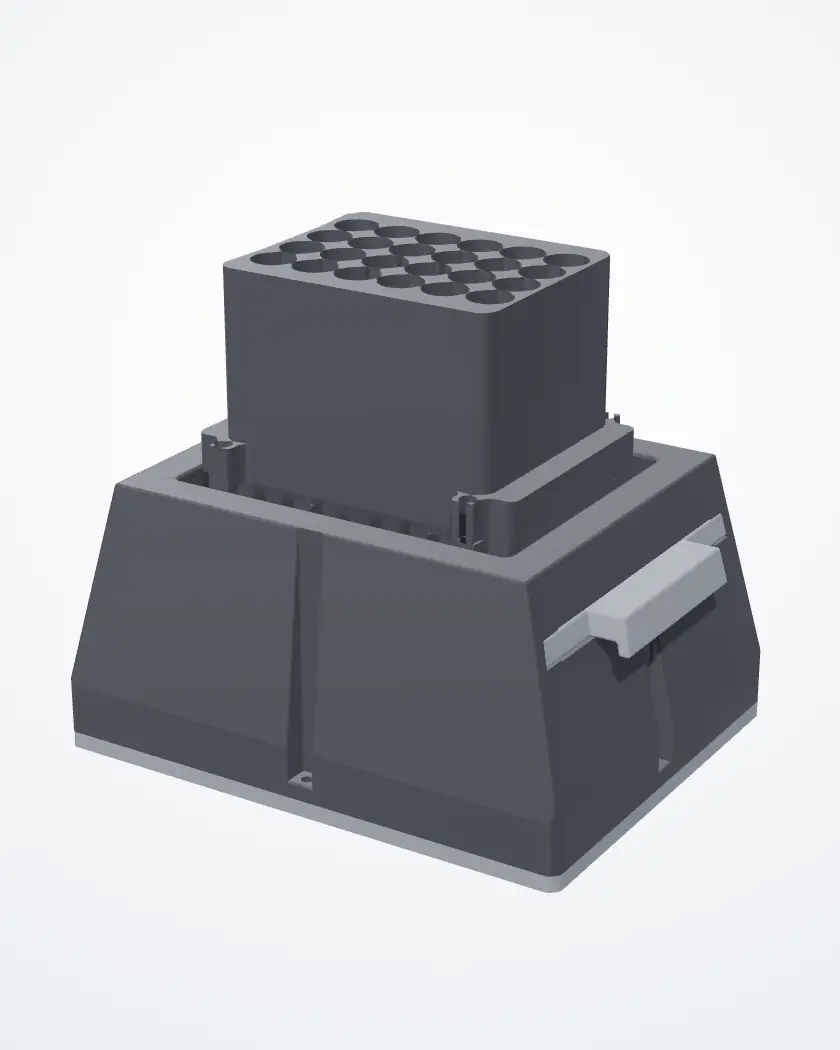
- Array
- 4 × 6 on an 18 mm pitch; 24 cultures
- Light conditions
- 6: green and red, each at low, mid and high; 4 replicate tubes per condition
- Channels
- Green and red
- LEDs
- 24 in PCV‑220 sockets, matched in fours from 40 measured one by one (within 0.4–1.8%)
- Intensity control
- PWM per tier, set in code before the run and held constant: pins 9, 10, 11 at analogWrite 5, 31, 255 (about 2%, 12%, 100%)
- Controller
- Arduino Uno R4 WiFi
- Drivers
- 3 × IRLZ44N logic‑level MOSFETs, one per tier; each switches a green and a red column
- Tube bores
- 24 × 17 mm, 1 mm wall between bores, 4 wall loops, black PLA
- Footprint
- 211 × 164 mm; 217 mm across the sliders
- Height
- 108 mm without the tube holder; 188 mm with it
- Printed parts
- 6, in black and grey PLA
- Assembly
- Printed sliders through the housing carry both holders; 4 × M6, 4 × #10‑32 and 4 × M3 screws (5.1); only a screwdriver is needed
- Cost
- US$65.52 (NT$2,097): US$44.06 parts + US$21.46 filament (5.1)
The parts, numberedas in the model and the STL downloads
Printed parts 1–6
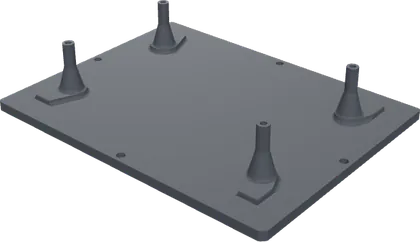
- 1Base plate (Bottom_Plate)Closes the bottom and carries the perf board on four stands; screwed to the housing at four points.
- 2Left slider (Left_C)Slides in through the housing’s side and carries the LED and tube holders.
- 3Right slider (Right_C)The same, on the other side.
- 4Housing (LPA_Box)Encloses the LEDs and the electronics from outside light.
- 5LED holder (LED_Holder)Holds the 24 LEDs in their sockets on the 18 mm grid.
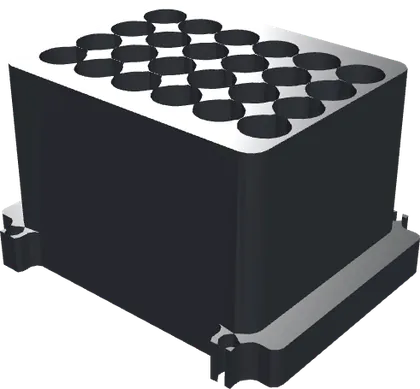
- 6Tube holder (Tube_Holder)Holds each tube over its own LED; black, 4 wall loops, to stop light crossing.
Bought part 7
- 7Perf boardCarries the three MOSFETs under the LED holder.
4.2 Light Layout
The array, from above
One well, in section
Each column of four is one light condition. A tier is a green column and a red column driven by the same MOSFET, so the two wavelengths at one tier share one duty cycle. The duty cycles are fixed in code before the run, so every tube gets the same light from start to finish.
Why green and red?three reasons
- Green turns production on. In the CcaS/CcaR system, green light activates the CcaS sensor, which switches on CcaR and, through it, the production genes.
- Red turns it off. Red light switches CcaS back to its inactive form.
- One array asks both questions. With both colors at three intensities, one run shows how strongly production follows the light and whether red stops it.
Why match the LEDs and still use PWM?matching evens, PWM sets
Matching cut the spread inside each group from 26% (green) and 22% (red) to 0.4–1.8%, but left the three groups too close together to serve as tiers (2.2). Matching therefore equalizes the LEDs within a condition, and PWM sets the intensity between conditions.
4.3 Design Decisions
| Requirement | How the final design meets it |
|---|---|
| The same light in every tube of a condition | Every LED measured one by one; the four in each column matched within 0.4–1.8%. |
| Three clearly different intensities | Each tier’s brightness set by PWM duty cycle in code, through its own MOSFET. |
| Fixed illumination for the whole run | Duty cycles set before the run and not changed; no feedback in the light path. |
| No outside light | LEDs and electronics enclosed in the housing; the tube holder closes the top. |
| No light from the neighboring well | Black tube holder with 4 wall loops, replacing the white one with 2 that leaked; not yet re‑tested. |
| The same distance every run | The tube holder seats each tube at a fixed height over its own LED. |
| Survives a night on a shaker | Base plate held at four screw points, not two; solder joints reinforced; not yet re‑tested. |
| Simple to assemble and open | The sliders slide in through the housing and carry both holders; twelve screws in three sizes hold the rest, so only a screwdriver is needed (5.3). |
Reproduction
5.1 Materials List
Parts priced from the team’s cost table; filament from the slicer. Costs in US$, converted at NT$32 to the dollar.
| Component | Part number / spec | Qty | Unit (US$) | Total (US$) | Total (NT$) |
|---|---|---|---|---|---|
| Green LED | 5 V, built‑in resistor | 12 | 0.20 | 2.40 | 77 |
| Red LED | 5 V, built‑in resistor | 12 | 0.20 | 2.40 | 77 |
| LED sockets | PCV‑220 | 24 | 0.10 | 2.40 | 77 |
| MOSFET | IRLZ44N, logic‑level | 3 | 1.00 | 3.00 | 96 |
| Microcontroller | Arduino Uno R4 WiFi | 1 | 27.50 | 27.50 | 880 |
| Perf board | 160 × 100 mm | 1 | 1.16 | 1.16 | 37 |
| Jumper wire | 20 AWG, 10 cm | 12 | 0.10 | 1.20 | 38 |
| Screws | M6 × 45 mm, stainless | 4 | 0.52 | 2.08 | 67 |
| Screws | #10‑32 × ½ in, stainless | 4 | 0.23 | 0.92 | 29 |
| Screws | M3 × 10 mm, stainless | 4 | 0.14 | 0.56 | 18 |
| Heat‑set inserts | M3, brass | 4 | 0.11 | 0.44 | 14 |
| Parts subtotal | 44.06 | 1,410 | |||
| Filament | Bambu PLA Matte, 933.4 g (5.2) | 22.99/kg | 21.46 | 687 | |
| Total | 65.52 | 2,097 |
Screws and inserts are priced per unit from packs: M3 heat‑set inserts, US$10.99 per 100; M3 × 10 mm stainless screws, US$13.50 per 100; M6 × 45 mm stainless socket head screws, US$51.89 per 100; #10‑32 × ½ in stainless, US$23.29 per 100. Four M6 screws hold the tube holder and the LED holder to the sliders, four #10‑32 the base plate to the housing, and four M3 the perf board, into the inserts in the base plate’s stands.
Matching needs spares. Twelve of each color go into the array, but they were picked from twenty of each (2.2, Test). Buying 20 + 20 to match from costs US$8.00 in LEDs instead of US$4.80.
Equipment
Light meter, 5 V bench power supply, 3D printer, soldering iron, calipers, a screwdriver for the assembly, and the printed sensor fixture used for LED matching.
5.2 Design Files
The LPA’s six printed parts and its perf board, numbered as in its 3D model (4.1). Each STL downloads under a descriptive name, in millimeters and in the instrument’s own coordinates, so the parts open already assembled. The six printed parts take 933.4 g of Bambu PLA Matte (US$22.99/kg), US$21.46 in all; each card gives its print’s filament and weight from the slicer.
The seven STLssix printed parts and the perf board
- 1Base plate
Closes the bottom and carries the perf board on four stands; screwed to the housing at four points.
Grey PLA · 125.7 g · US$2.89
- 2Left slider
Slides in through the housing’s side and carries the LED and tube holders.
Black / grey PLA · one plate with the LED holder and the right slider: 174.1 g, US$4.00 for the three
- 3Right slider
The same, on the other side.
Black / grey PLA · one plate with the LED holder and the left slider: 174.1 g, US$4.00 for the three
- 4Housing
Encloses the LEDs and the electronics from outside light.
Black PLA · 383.6 g · US$8.82
- 5LED holder
Holds the 24 LEDs in their sockets on the 18 mm grid.
Black / grey PLA · one plate with both sliders: 174.1 g, US$4.00 for the three
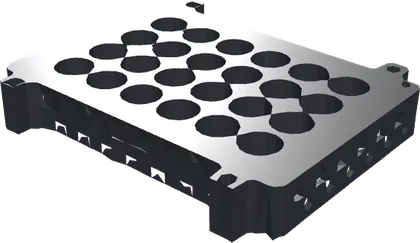
- 6Tube holder
Holds each tube over its own LED; black, 4 wall loops, to stop light crossing.
Black PLA, 4 wall loops (2.3, Learn) · 250.0 g · US$5.75
- 7Perf board
Bought, not printed: carries the three MOSFETs under the LED holder. Its STL is for checking the fit.
For the Arduino Uno R4 WiFi: holds the three intensity tiers by PWM on pins 9, 10 and 11 for the whole run.
5.3 Assembly Guide
Six stages, from printing the parts to loading the run sketch, with the parts list and a check after each. 10 pages.
Safety. The LPA runs on 5 V: unplug the Arduino and switch off the bench supply before changing any wiring, and do not look straight into the LEDs at full brightness (the guide’s “Before you start” page). The cultures are B. subtilis, handled at BSL‑1 as set out on the team wiki’s Safety page.
References
Illuminating a plate of cultures from below with per‑well control is the Light Plate Apparatus pattern from the optogenetics literature1, which our LPA follows and is named after. What we added is the dual‑wavelength column layout and LEDs matched by measured output, in an enclosure sized for our own tubes.
The biology is the CcaS/CcaR green/red switch, also from the literature, not designed here; it was characterized in B. subtilis by Castillo‑Hair and colleagues2. This page reports light in lux and does not convert it to photon flux, so our tiers are not placed on that paper’s dose scale.
- Gerhardt KP, Olson EJ, Castillo‑Hair SM, et al. An open‑hardware platform for optogenetics and photobiology. Scientific Reports 6, 35363 (2016). doi:10.1038/srep35363
- Castillo‑Hair SM, Baerman EA, Fujita M, Igoshin OA, Tabor JJ. Optogenetic control of Bacillus subtilis gene expression. Nature Communications 10, 3099 (2019). doi:10.1038/s41467-019-10906-6