ReLEAF Perfusion Bioreactor
Overview
A closed loop for continuous production and physical containment.
The ReLEAF perfusion bioreactor is a closed culture system that grows engineered B. subtilis continuously and keeps the cells inside it. Culture circulates through the lumen side of a hollow‑fiber membrane, and smaller soluble products cross the membrane into a separate collection stream.
Purpose
2.1 From TgPGPR to a Bioreactor
Crop stress is becoming more frequent and harder to predict as the climate changes. Our original design applied a transgenic plant‑growth‑promoting rhizobacterium (TgPGPR) in the field, where it would colonize the roots and make a protectant on site.
We chose a bioreactor instead, for two reasons. Biosafety: once a transgenic organism is released, its expression, dose and spread can no longer be controlled. Survival: laboratory strains of B. subtilis lack motility, cannot form biofilm and have metabolic deficiencies, so they would compete poorly in the field.
Only the protectant needs to reach the field. The organism therefore stays in a closed vessel, and only its product leaves.
2.2 Choice of B. subtilis and Hollow‑Fiber Perfusion
We chose Bacillus subtilis because the FDA classifies nonpathogenic, nontoxigenic strains as Generally Recognized as Safe (GRAS) under good manufacturing practices. It is easier to engineer than many other microbes, and it secretes recombinant protein into the medium, so the protectant can be collected without lysing the cells.
B. subtilis 168 ran the growth tests and the first integrated run; every later run used the protease‑deficient B. subtilis WB800 (4.2, prototype 1). Both are nonpathogenic laboratory strains, and the hardware is the same for either.
Secretion suits a hollow‑fiber reactor. Culture circulates through the fiber lumens while medium flows past on the shell side; the protectant crosses the membrane and the bacteria do not. Because the cells stay intact, the culture can produce at high density for days. The longest logged run is 116 hours.
2.3 On‑Site Production
Peptides degrade in storage and often need a cold chain, so a stored product can lose potency before use. Production on site gives a fresh protectant at a known dose, and removes the cost of refrigerating and shipping a product that is mostly water.
Hardware Highlights
3.1 Hollow‑Fiber Perfusion
Medium is exchanged while the culture runs: waste leaves and nutrients arrive without stopping the run. Cell density is held at a steady level, and the product leaves as a continuous stream.
3.2 Containment and Product Release
The membrane is also the separation step. Its pore size admits the protectant and excludes the cells, so one component both contains the organism and delivers the product. Everything that reaches the plant has passed through pores narrower than the cells.
3.3 Integrated Monitoring
An in‑line photometer reads OD600 through a flow cell without drawing a sample. pH is measured in the vessel and transmembrane pressure is tracked, so fouling shows as a trend. All readings go to one web dashboard on the local network.
3.4 The System, Stage by Stage
As designed
-
Culture in the reservoir
A stirred 1 L medium reservoir. Expression is induced by a green light signal driven by the AIoT stress predictor. A magnetic stir bar runs at 200 rpm — added in bacteria‑growth DBTL 2 (photometer page), after sedimentation was diagnosed. A pH probe sits in the reservoir’s cap, so the culture’s pH is read where it grows.
-
Read without opening the loop
The peristaltic pump draws culture from the reservoir outlet, past the Luer sampling valve, and drives it at 94 mL/min through the in‑line photometer and into the top of the membrane column. The pump acts on the outside of the tubing only, so the fluid path is not breached at the pump head.
-
The only crossing
A hollow‑fiber membrane splits the system in two. This wall is the single place the two circuits touch, and the organism is retained on the lumen side.
-
Nothing leaves the culture loop
Culture returns down the lumens to the reservoir through a servo‑driven pinch valve, which clamps the return line to set the pressure across the fibers. A small pump doses KOH from a second bottle into this return line, to hold the pH the probe in the cap reads. Nothing leaves the culture loop except through the membrane wall.
-
Harvest, on the shell side
A second pump moves shell‑side fluid out of the column. Anything in that stream crossed the fiber wall, whose 0.2 µm pore is smaller than a B. subtilis cell; shell‑side medium plated in bacteria‑growth DBTL 1 (photometer page) produced no colonies (8).
-
Out to delivery
Shell‑side fluid leaves the machine for the delivery stages, a soil or hydroponic line.
-
One closed loop, one open path
Culture circulates and never leaves. What crosses the membrane wall and goes to the field is the protectant together with anything else below the 0.2 µm pore — medium components, vesicles, debris (8). Whole cells are what the wall is there to stop. Containment is physical at the membrane wall; the Luer sampling valves are the one place procedure still matters.
Engineering Cycles
The bioreactor is built around a 0.2 µm mPES hollow‑fiber membrane that keeps the cells on the lumen side and lets the protectant cross to the shell side. Flow and pressure across it show whether perfusion holds at the set rate and whether the membrane is fouling. The cycles below measure flow and pressure (4.1) and run the whole loop in the integrated bioreactor (4.2). The bacterial growth cycles are in part 2 of the photometer page.
4.1 Hollow Fiber Membrane
This track mapped pump output (%) to flow rate Q and to the pressure that flow builds across the membrane, so that conditions inside the bioreactor can be set through pump output alone. Two manual rounds gave operator‑dependent results. The instrumented third round separated the membrane from the plumbing and set an operating point of 263 mL/min at a TMP of 0.30 bar. A magnetic pump tried for long runs could not move the medium, so the peristaltic pump was kept.
Prototype 1 of 4
Prototype 1 – Manual PQ
Round 1: three pressure sensors, flow measured by hand
Design
The goal was a ΔP–Q relationship: the pressure across the membrane known from pump output, without measuring flow and pressure by hand each time. Round 1 placed a pressure sensor at each of the module’s three ports: feed (medium entering the lumen side), retentate (medium leaving it) and permeate (the shell side). Transmembrane pressure (TMP) is the mean lumen pressure less the shell pressure: TMP = (Pfeed + Pretentate) / 2 − Ppermeate. The pump stepped from 10% to 100% output in 10% steps, one minute per setting.
Build
Three pressure sensors were installed at the feed, retentate and permeate ports: BP8G‑AGB ceramic pressure transmitters (Jingfeng), 0–1 MPa gauge, three‑wire 0–5 V output (10.1), 1.0% of full scale overall accuracy. The loop ran on water. Q was measured by hand in this round and in round 2: at each output the pump drew water from a container into an empty measuring cylinder for one minute, and Q is the volume collected.
The pressure transmitterBP8G‑AGB, from its manual
- Ceramic pressure transmitter by Ningbo Jingfeng; gauge ranges from 0–1 to 0–5 MPa, ours 0–1 MPa.
- Overload up to 2× full scale; bursts above 3×.
- Non‑linearity 0.25%, repeatability 0.1%, hysteresis 0.2%; 1.0% of full scale overall (20 °C, best fit straight line).
- Operates from −20 to +85 °C, compensated 0–50 °C, 0.03%/°C typical; drift under 0.5% of full scale a year.
- Outputs offered: 4–20 mA two‑wire; three‑wire voltage (0–5, 1–5 or 0.5–4.5 V on 10–30 V DC or 5 V DC; 0–10 V on 12–30 V DC); ratiometric on 4.5–5.5 V. Voltage outputs want a load above 10 kΩ.
- Three‑wire wiring: pin 1 red, supply +; pin 2 black, ground; pin 3 yellow, signal out.
- SS304 port and housing, 96% alumina ceramic diaphragm, HNBR seal; GX12 three‑pin connector on a 1 m cable; IP65; about 120 g.
Test
Outputs from 10% to 60% were measured three times, and 70% to 100% once. Mean Q rose from 100.3 mL/min at 10% to 1535 mL/min at 100%. Up to 50%, each 10% step added about 210–225 mL/min, close to linear. Above 50% the steps shrank, to about 55 mL/min between 80% and 90%, which suggests the pump was nearing its maximum delivery. Repeated outputs agreed within 12 mL/min.
| Pump output | Trial 1 (mL/min) | Trial 2 (mL/min) | Trial 3 (mL/min) | Average (mL/min) |
|---|---|---|---|---|
| 10% | 103 | 100 | 98 | 100.3 |
| 20% | 315 | 312 | 315 | 314 |
| 30% | 536 | 540 | 538 | 538 |
| 40% | 760 | 764 | 768 | 764 |
| 50% | 978 | 975 | 984 | 979 |
| 60% | 1131 | 1140 | 1128 | 1133 |
| 70% | 1260 | – | – | 1260 |
| 80% | 1360 | – | – | 1360 |
| 90% | 1415 | – | – | 1415 |
| 100% | 1535 | – | – | 1535 |
The pressure readings from this round were not usable; only the flow rates are reported.
Learn
Pump output gives a repeatable Q, which the relationship needs. The TMP readings were not usable, and no independent measurement confirmed Q during the pressure runs. Q therefore had to be measured alongside pressure, ideally in real time; round 2 measured it in every pressure run.
Prototype 2 of 4
Prototype 2 – Manual PQ
Round 2: flow timed by hand in every pressure run
Design
Round 2 measured Q in the same runs as pressure, so every pressure reading had its own flow reading. With no flow instrument yet, Q was measured by hand, by several team members following the same protocol.
Build
The loop and the three sensors were those of round 1. At each pump output, water was collected for one minute in a 1000 mL measuring cylinder and its volume read. The outputs were 10% to 22% in 2% steps (seven settings), and about five team members took the measurements.
Test
Two manual rounds by different people were compared. In the first, results varied from person to person under the same protocol. Each of its three series is roughly linear (R2 0.91–0.95), but the slopes range from 0.0002 to 0.0017 bar per mL/min.
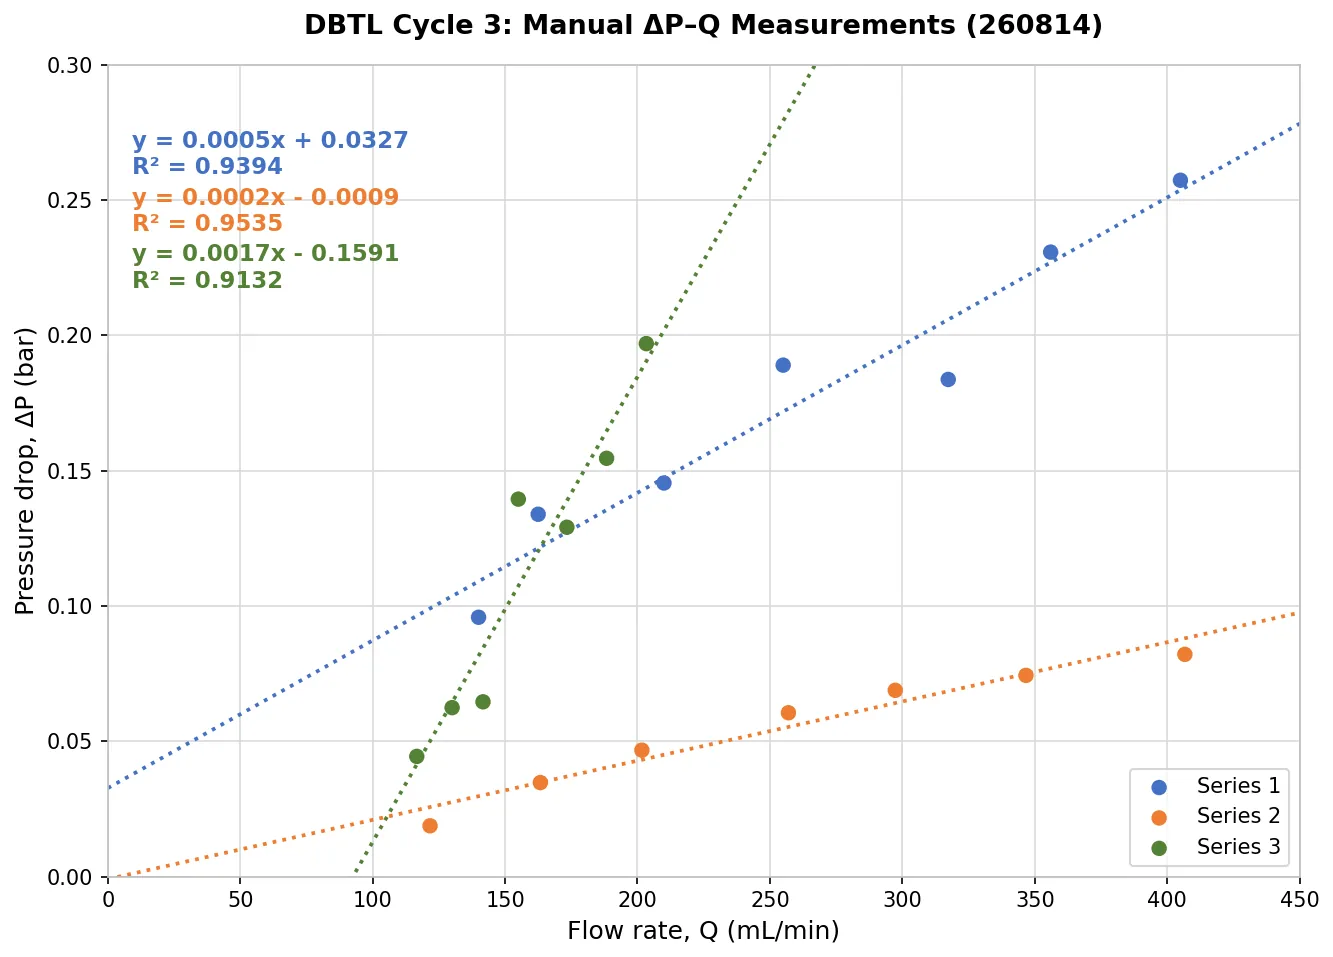
At the same pump output, 22%, the three sets read:
- 405 mL/min at 0.257 bar (3.73 psi)
- 407 mL/min at 0.082 bar (1.19 psi)
- 203 mL/min at 0.197 bar (2.86 psi)
Under the same conditions, pressure differed more than threefold and flow rate by half.
The readings, repeated three times at the same outputs:
The readings57 readings, 3 repeats
| Repeat | Pump output | Q (mL/min) | Pressure (psi) | Pressure (bar) |
|---|---|---|---|---|
| 1 | 10% | 110 | 0.537 | 0.03702 |
| 1 | 10% | 120 | 0.7915 | 0.05457 |
| 1 | 10% | 120 | 0.604 | 0.04164 |
| 1 | 12% | 150 | 0.8135 | 0.05608 |
| 1 | 12% | 155 | 0.6915 | 0.04767 |
| 1 | 12% | 160 | 1.2115 | 0.08352 |
| 1 | 14% | 205 | 0.6635 | 0.04574 |
| 1 | 14% | 200 | 0.624 | 0.04302 |
| 1 | 14% | 205 | 1.5225 | 0.10497 |
| 1 | 16% | 250 | 2.0139 | 0.13885 |
| 1 | 16% | 239 | 2.0808 | 0.14346 |
| 1 | 16% | 240 | 1.9742 | 0.13611 |
| 1 | 18% | 280 | 2.155 | 0.14858 |
| 1 | 18% | 284 | 2.3113 | 0.15935 |
| 1 | 18% | 283 | 2.2592 | 0.15576 |
| 1 | 20% | 337 | 3.0403 | 0.20962 |
| 1 | 20% | 330 | 2.8888 | 0.19917 |
| 1 | 20% | 335 | 2.6403 | 0.18204 |
| 1 | 22% | 394 | 3.4089 | 0.23503 |
| 1 | 22% | 395 | 3.518 | 0.24255 |
| 1 | 22% | 387 | 3.219 | 0.22194 |
| 2 | 10% | 115 | 0.2003 | 0.01381 |
| 2 | 10% | 120 | 0.2825 | 0.01947 |
| 2 | 10% | 130 | 0.3339 | 0.02302 |
| 2 | 12% | 170 | 0.5282 | 0.03641 |
| 2 | 12% | 160 | 0.4203 | 0.02897 |
| 2 | 12% | 160 | 0.5633 | 0.03883 |
| 2 | 14% | 200 | 0.5225 | 0.03602 |
| 2 | 14% | 200 | 0.7708 | 0.05314 |
| 2 | 14% | 205 | 0.7393 | 0.05097 |
| 2 | 16% | 253 | 0.8101 | 0.05585 |
| 2 | 16% | 264 | 0.9423 | 0.06496 |
| 2 | 16% | 254 | 0.8818 | 0.06079 |
| 2 | 18% | 307 | 1.1805 | 0.08139 |
| 2 | 18% | 290 | 0.8807 | 0.06072 |
| 2 | 18% | 295 | 0.9339 | 0.06439 |
| 2 | 20% | 345 | 0.9324 | 0.06428 |
| 2 | 20% | 350 | 1.1345 | 0.07822 |
| 2 | 20% | 345 | 1.1684 | 0.08055 |
| 2 | 22% | 395 | 1.26 | 0.08687 |
| 2 | 22% | 420 | 1.1794 | 0.08131 |
| 2 | 22% | 405 | 1.1339 | 0.07817 |
| 3 | 10% | 140 | 1.390 | 0.09583 |
| 3 | 12% | 160 | 1.817 | 0.12527 |
| 3 | 12% | 165 | 2.067 | 0.14251 |
| 3 | 14% | 210 | 1.553 | 0.10707 |
| 3 | 14% | 210 | 2.666 | 0.18381 |
| 3 | 16% | 255 | 2.214 | 0.15264 |
| 3 | 16% | 255 | 3.3365 | 0.23004 |
| 3 | 16% | 255 | 2.673 | 0.18429 |
| 3 | 18% | 327 | 2.781 | 0.19174 |
| 3 | 18% | 305 | 2.436 | 0.16795 |
| 3 | 18% | 320 | 3.0136 | 0.20778 |
| 3 | 18% | 320 | 2.427 | 0.16733 |
| 3 | 20% | 355 | 3.239 | 0.22332 |
| 3 | 20% | 357 | 3.455 | 0.23821 |
| 3 | 22% | 405 | 3.732 | 0.25731 |
Learn
The setup and pump output were the same; only the operator changed, so measurement technique set these results. Timing a collected volume depends on each operator’s timing and reading, and each manual step adds error. A reliable ΔP–Q relationship needed Q and pressure read by instruments.
Prototype 3 of 4
Prototype 3 – Automatic PQ
Every reading by instrument; the plumbing subtracted
Design
Round 2 showed that manual measurement set the spread. Round 3 removed manual operation: pressure came from the transducers and Q from an in‑line flowmeter. This removes reading error, the error of inferring Q from the pump setting, and inconsistencies between operators.
Part of the pressure drop comes from the plumbing (valves, fittings and the flow cuvette), so round 3 also separated the membrane from the rest of the loop. The loop was measured at the same pump outputs without the module and with it, changing nothing else; the difference is the module’s own contribution.
The pressure drop was to be fitted with a through‑origin quadratic model:
The linear term represents laminar friction along the fibers and tubing; the quadratic term represents minor losses at the valves, fittings and flow cuvette. The fit passes through the origin because the pressure drop is zero at zero flow.
Build
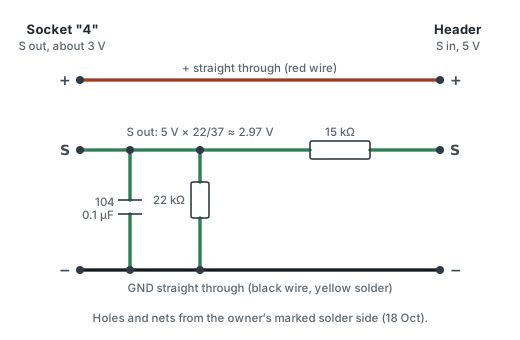
Pressure transducers. A two‑resistor divider scales the transducers’ 0–5 V output to the microcontroller’s 0–3.3 V analog input (the BP8G‑AGB transmitter, round 1).
Flowmeter. A Hall‑effect flowmeter: a magnet on an internal rotor spins with the flow, a fixed sensor detects the passing field, and the pulse frequency is converted to Q.
Two configurations. In the Background configuration a silicone tubing jumper replaced the membrane module, with every valve, fitting and the flow cuvette in place. In the HFM configuration the module was fitted and nothing else changed.
Test
Both configurations ran on 16 August 2026 at pump outputs of 10% to 24% in 2% steps, one minute each. Both data sets fit the model with R2 0.995, with no systematic trend in the residuals.
The readings and the fits8 pump outputs, 2 configurations
| Pump output | Background Q (mL/min) | Background ΔP (bar) | HFM Q (mL/min) | HFM ΔP (bar) |
|---|---|---|---|---|
| 10% | 119.878 | 0.02367 | 113.368 | 0.06397 |
| 12% | 170.724 | 0.05408 | 163.282 | 0.10300 |
| 14% | 216.416 | 0.07971 | 215.850 | 0.14279 |
| 16% | 274.849 | 0.09996 | 263.323 | 0.18566 |
| 18% | 317.333 | 0.14297 | 312.731 | 0.27363 |
| 20% | 349.582 | 0.16585 | 355.193 | 0.30248 |
| 22% | 395.225 | 0.19910 | 401.328 | 0.38318 |
| 24% | 440.428 | 0.24271 | 450.065 | 0.45271 |
| Configuration | a (bar·min/mL) | b (bar·min2/mL2) | R2 | Residual SD (bar) |
|---|---|---|---|---|
| Background | (1.383 ± 0.294) × 10−4 | (9.388 ± 0.815) × 10−7 | 0.9950 | 0.0057 |
| HFM | (3.810 ± 0.495) × 10−4 | (1.399 ± 0.135) × 10−6 | 0.9954 | 0.0101 |
| Net (difference) | (2.427 ± 0.576) × 10−4 | (4.604 ± 1.575) × 10−7 | – | – |
The two configurations did not reach exactly the same flow rates, so the module’s pressure drop could not be found point by point. Instead, the Background fit predicted the plumbing’s pressure drop at each HFM flow rate, and this prediction was subtracted from the HFM measurement. The plumbing accounts for 46% of the total at 120 mL/min and 55% at 450 mL/min. Without the subtraction, the membrane’s hydraulic resistance would be overstated by about a factor of two.
The net pressure drop was compared with the Hagen–Poiseuille prediction for laminar flow through the fibers. From 113 to 263 mL/min it is 0.90–0.96 times the prediction; above 300 mL/min the ratio rises to 1.07–1.26. We attribute the excess to minor losses where the flow contracts from one wide channel into eleven narrow fibers, and to entrance effects before the velocity profile is fully developed.
Two geometry checks agree. The net pressure drop gives an effective count of about 11 open fibers, the module’s nominal count, so no fiber appears blocked. The shear rate calculated from Q agrees within 2.8% with the shear rate back‑calculated from the wall shear stress.
The membrane against theory, point by pointthe plumbing’s share; net ΔP vs. theory
| Q | HFM total ΔP (bar) | Background ΔP (bar) | Background share |
|---|---|---|---|
| 120 mL/min | 0.066 | 0.030 | 46% |
| 200 mL/min | 0.132 | 0.065 | 49% |
| 275 mL/min | 0.211 | 0.109 | 52% |
| 350 mL/min | 0.305 | 0.163 | 54% |
| 450 mL/min | 0.455 | 0.252 | 55% |
| Q | Net ΔP (bar) | Theoretical ΔP (bar) | Ratio |
|---|---|---|---|
| 113.4 mL/min | 0.0362 | 0.0401 | 0.90 |
| 163.3 mL/min | 0.0554 | 0.0578 | 0.96 |
| 215.9 mL/min | 0.0692 | 0.0764 | 0.91 |
| 263.3 mL/min | 0.0842 | 0.0931 | 0.90 |
| 312.7 mL/min | 0.1386 | 0.1106 | 1.25 |
| 355.2 mL/min | 0.1349 | 0.1256 | 1.07 |
| 401.3 mL/min | 0.1765 | 0.1420 | 1.24 |
| 450.1 mL/min | 0.2003 | 0.1592 | 1.26 |
The prediction and the shear rates use the fibers’ inner diameter of 1 mm and the prediction their length of 0.60 m, for 11 fibers.
Learn
Round 3 gave the ΔP–Q relationship the track set out to find, ΔP = aQ + bQ2, with a physical interpretation: laminar friction plus minor losses. Two results carry forward. The plumbing must be subtracted before the membrane is assessed, or its resistance reads about double. In the operating range the membrane behaves as theory predicts, with all eleven fibers open.
These results set the operating window. The recommended point is 263 mL/min (shear rate about 4060 s−1) at a TMP of 0.30 bar. It is mid‑range in the manufacturer’s shear‑rate window of 2000–6000 s−1, keeps TMP low enough to avoid irreversible compaction of the membrane, and gives an axial TMP non‑uniformity of 28%, within the acceptable range before filtration becomes uneven along the fiber. At 313 mL/min the non‑uniformity reaches 46% (not recommended); at 450 mL/min, 67% (prohibited).
| Q | Net ΔP (bar) | γ (s−1) | Non‑uniformity at | Assessment | |
|---|---|---|---|---|---|
| TMP 0.2 bar | TMP 0.3 bar | ||||
| 140 mL/min | 0.045 | 2161 | 23% | 15% | Usable (conservative) |
| 216 mL/min | 0.069 | 3331 | 35% | 23% | Usable |
| 263 mL/min | 0.084 | 4064 | 42% | 28% | Recommended |
| 313 mL/min | 0.139 | 4826 | 69% | 46% | Not recommended |
| 450 mL/min | 0.200 | 6946 | 100% | 67% | Prohibited |
Long continuous runs raised one more question: the peristaltic pump that holds this point wears mechanically.
Prototype 4 of 4
Prototype 4 – Magnetic Pump Test
A wear‑free pump for long runs
Design
Bioreactor runs last days, and the peristaltic pump’s limited operating life is a liability in extended use. A magnetic pump has no comparable mechanical wear, so it should last longer in continuous operation; we tested one as a replacement.
Build
The magnetic pump replaced the peristaltic pump in the loop. It is weaker and cannot lift liquid out of the serum bottle, so a gravity‑fed reservoir (a clear rectangular PC water‑cooling tank with top and bottom ports) was planned. The modification was suspended on 16 August, when the pump proved too weak for the bioreactor (notebook, week 24).
Test
The earlier calibration runs used water; this test used LB medium. The magnetic pump could not generate enough pressure to push the medium through the system, never sustained a working flow, and gave no usable data.
Learn
The peristaltic pump was kept. Its operating life is shorter, but it reliably moves the culture medium. It is the pump in the integrated bioreactor (4.2).
4.2 Integrative Bioreactor
Prototype 1 (pump control) was the first integrated run: 116 hours with B. subtilis 168. Prototype 2 moved to B. subtilis WB800, added the pinch valve, the pH probe and one mainboard, and found ACC deaminase on the shell side at the lumen’s level. Prototype 3, also B. subtilis WB800, held the pH with KOH and sterilized the loop in place. In all three, ACC deaminase is under a constitutive promoter, which removes light control so that the loop itself is what is examined. Reviewer feedback between the runs is in part 6.
Prototype 1 of 3
Prototype 1 – Pump Control
First integrated run: constitutive ACC deaminase production
Design
Each part had been tested alone: the in‑line photometer read optical density reliably for about 240 hours of a 434 h logged run (photometer page, 5.1), the bacteria had made ACC deaminase, and the pressure transducers and flowmeter had been tested on water (4.1, prototype 3). This cycle put every component into one system. It asked when B. subtilis reaches plateau in the loop, whether the system supports ACC deaminase production, and how the sensors perform together under operating conditions.
This prototype tests integration, not the optogenetic circuit: ACC deaminase is under a constitutive promoter, which removes light control as a variable. Culture circulates through the lumen side, protectant crosses to the shell side, and cells are retained; the rest of the loop keeps that separation running unattended. The run used 500 mL of medium at 37 °C to speed growth and shorten the run.
Build
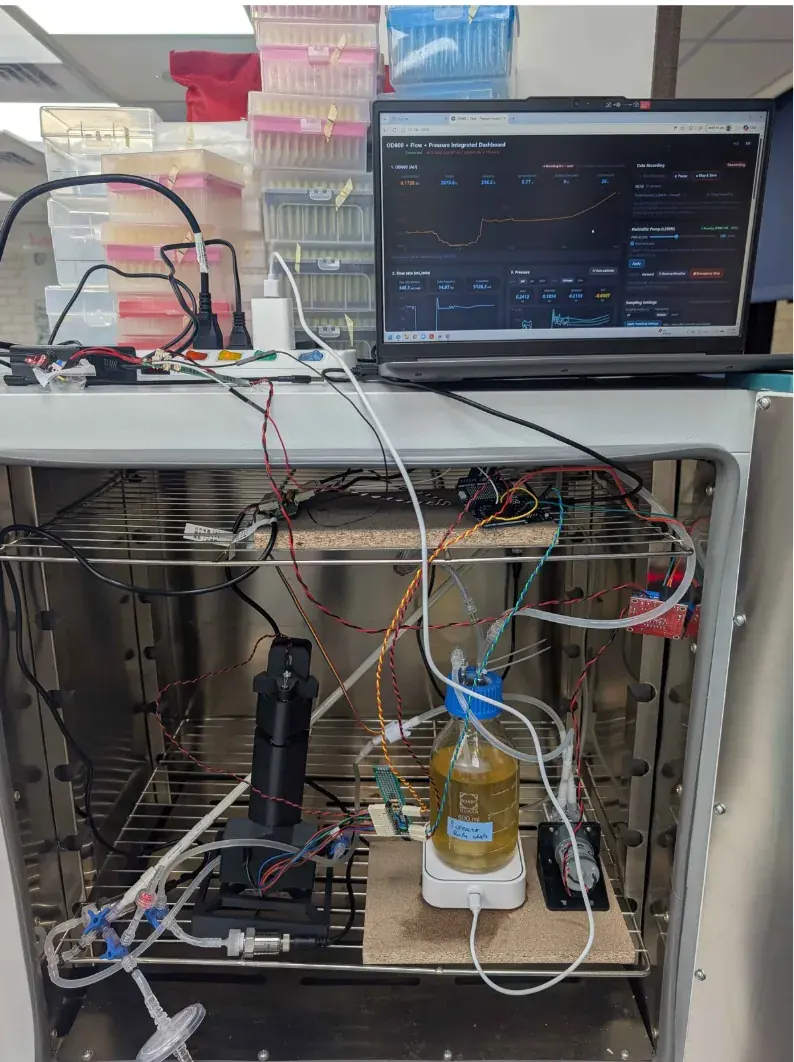
Structure. The loop has a lumen side and a shell side. On the lumen side, a peristaltic pump circulates the culture from a medium reservoir on a magnetic stirrer past three pressure transducers, one flowmeter and the in‑line photometer; a Luer valve allows sampling. In this run the shell side was a separate closed loop, also with a Luer sampling valve.
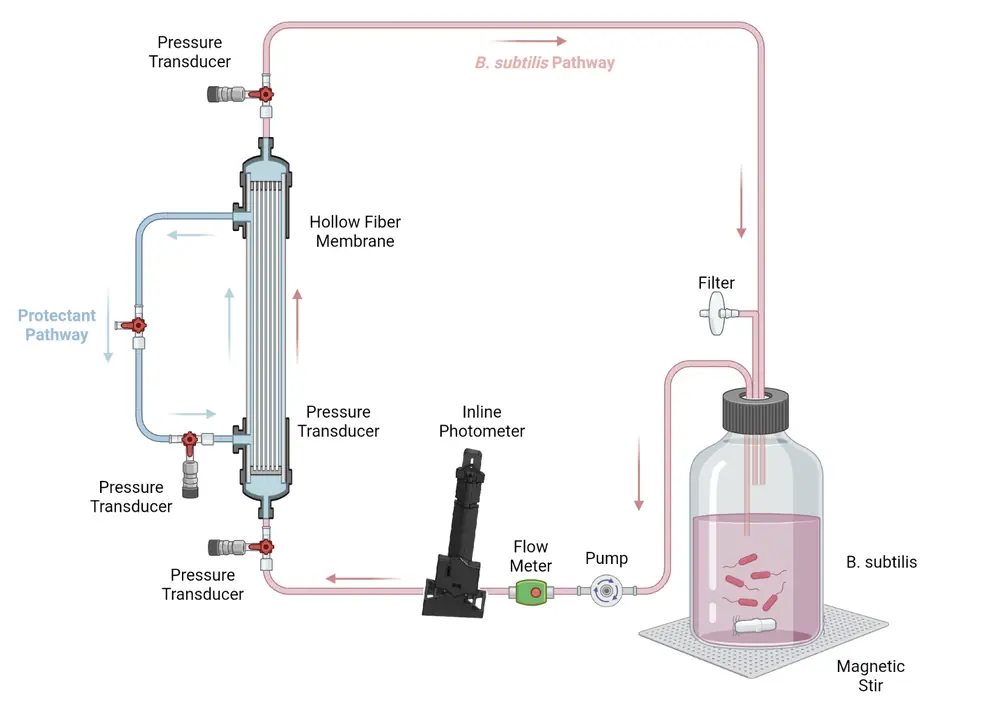
Electrical circuit. Transistors and capacitors were added so that the sensors read correctly. The photometer’s circuit is on its own page (photometer page, 9.2).
Gene circuit. B. subtilis 168 carrying pSTK‑EXP1‑Pveg‑Csn:AcdS, an expression vector that makes ACC deaminase constitutively. Erythromycin at 5 µg/mL kept the plasmid in the cells and guarded against contamination.
Test
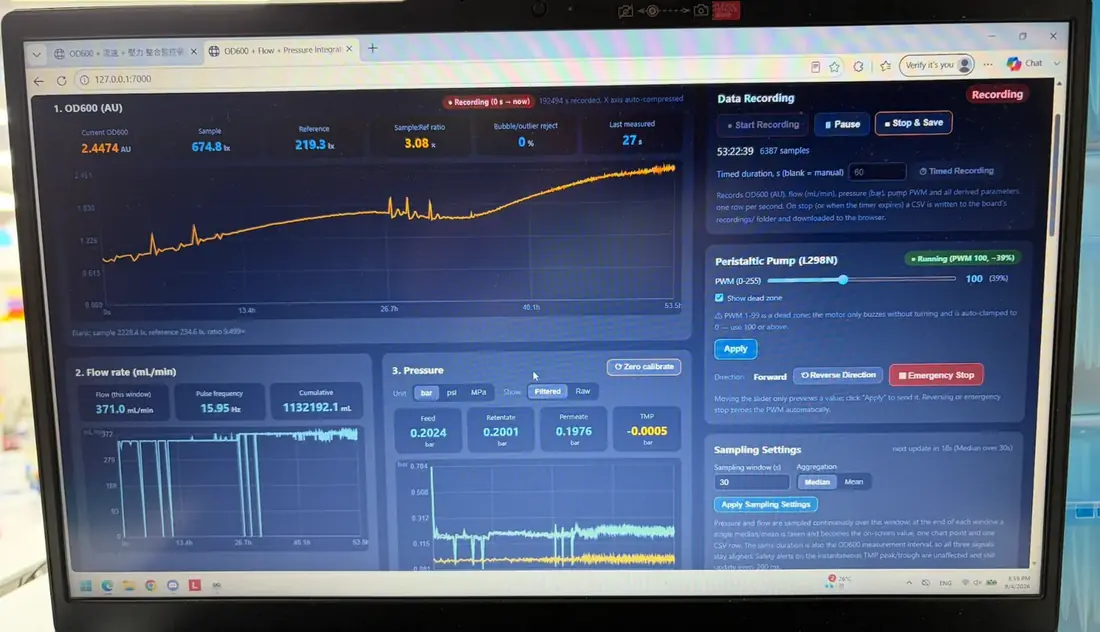
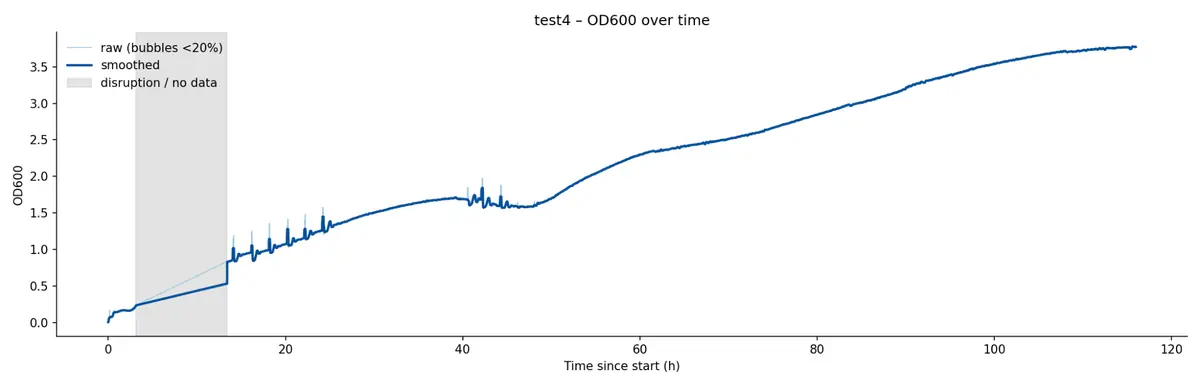
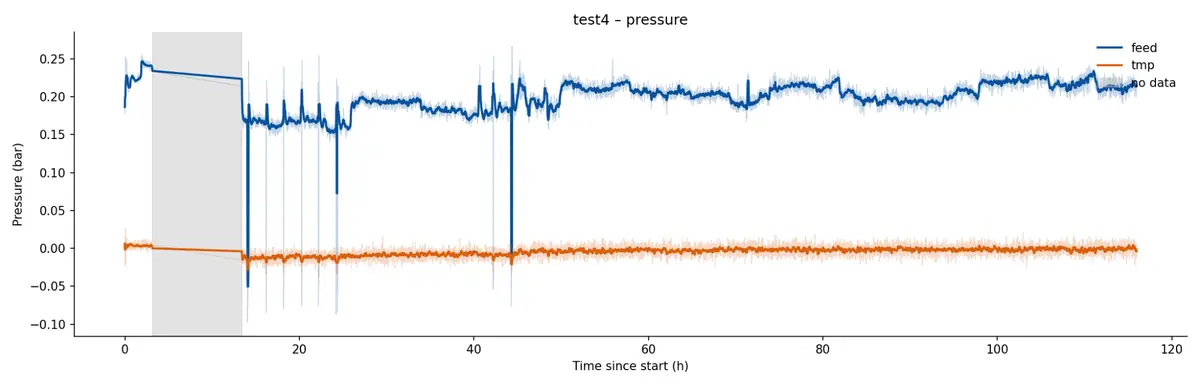
The run started on 1 September 2026 and lasted 116 hours. Partway through, the computer running the microcontroller installed an update and shut down; the data were held in the web interface, so about 10 hours were lost (grey band in the plots). The culture reached a plateau at about 40 hours. At about 47 hours a second growth phase began and continued to the end of the run.
The pressure readings were unstable throughout, did not respond when the loop was handled, and did not return to baseline even with the main pump stopped.
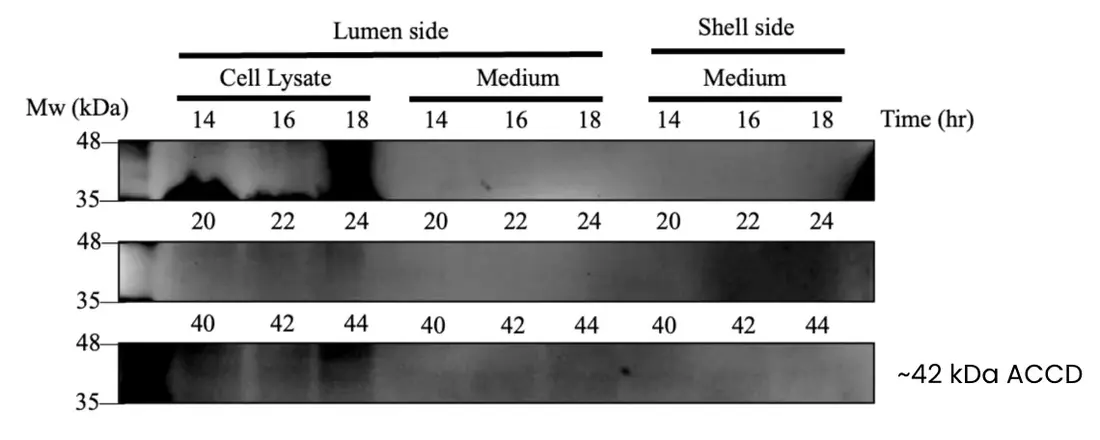
A faint band consistent with ACC deaminase (~42 kDa) appeared in shell‑side medium (the western blot below).
Learn
In the loop the bacteria reached plateau after about 40 hours, which is when detectable ACC deaminase appeared. A faint ~42 kDa band in shell‑side medium suggests that ACC deaminase reaches the shell side, but expression was weak.
A second growth phase after plateau does not fit a batch curve. Our working explanation is that the erythromycin degraded and the cells began to lose the plasmid, lowering their metabolic burden; Prof. Chang raised plasmid stability in September (6.1). B. subtilis 168 also produced barely detectable ACC deaminase, probably because it secretes protease that degrades the product, so the next prototype used B. subtilis WB800. The pressure readings remained unexplained; the electronics review that followed is in 6.2.
Prototype 2 of 3
Prototype 2 – Pinch Valve & pH
B. subtilis WB800, a pinch valve, a pH probe and one mainboard
Design
Prototype 2 responded to the findings of prototype 1 and the Owl Lab review. First, the host strain changed from B. subtilis 168 to B. subtilis WB800 (prototype 1, Learn).
Second, the hardware. The pressure transducers had read unstably, so they now run on 12 V DC instead of 5 V, grounded on the DC–DC module instead of the Arduino UNO Q. The old power supply could not deliver the current the motors and pumps need (6.2); the mainboard Owl Lab proposed (6.2) supplies both the voltage and the current.
Third, two parts were added: a pH probe and a servo‑driven pinch valve. The valve raises the transmembrane pressure to drive product from the lumen side to the shell side, the gap Prof. Chang identified in June (6.1). Both plug into the mainboard as modules. The medium volume went from 500 mL to 1 L, still at 37 °C.
Build
Structure. The shell side now drains to a reservoir that collects the product. The lumen side carries three pressure transducers, one flowmeter, the in‑line photometer, the pinch valve and the pH probe.
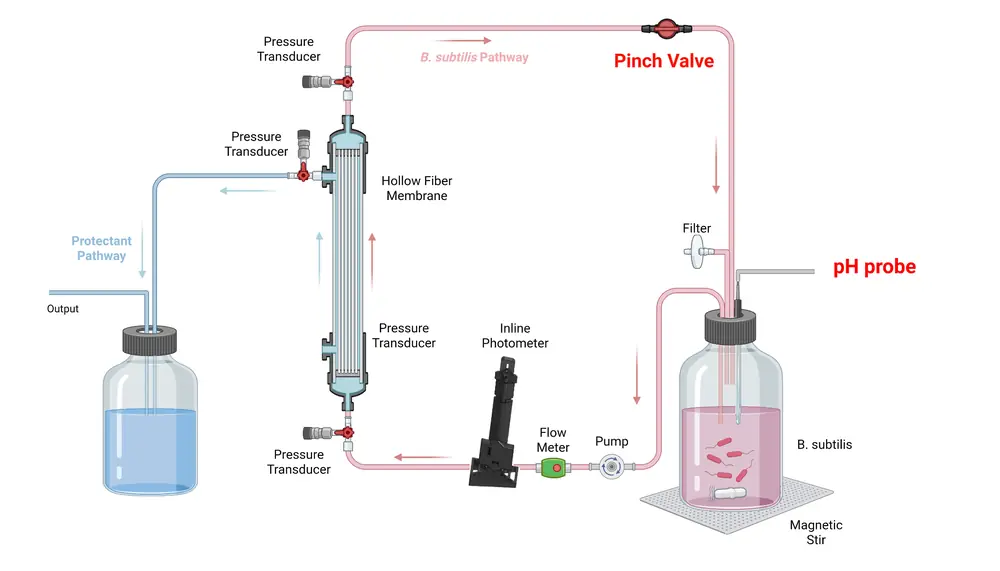
The pinch valve, a printed body holding an STS3215 12 V servo motor (10.2), clamps the return line about 50 mm (2 in) from the Out‑Lumen connection. The pH probe sits in a slot in the culture bottle’s cap and connects to the Arduino, and the dosing pump (5 mL/min) draws from a small KOH bottle through a Luer valve into the same return line.
Electrical circuit. The electronics are built around the mainboard, an extension of the UNO Q with room for design changes. It replaced the two‑board design after Owl Lab’s two reviews (6.2). The sensors were reworked to plug into it as modules: the photometer, a voltage converter for the pH, pressure and flow sensors, and the servo control (boards in 7.1.3).
Gene circuit. B. subtilis WB800 carrying pSTK‑EXP1‑SamyQ‑AcdS‑v2t1, with erythromycin kept at 5 µg/mL. The run started on 8 October 2026, with permeate drawn at 24 mL/min (notebook, week 32).
Test
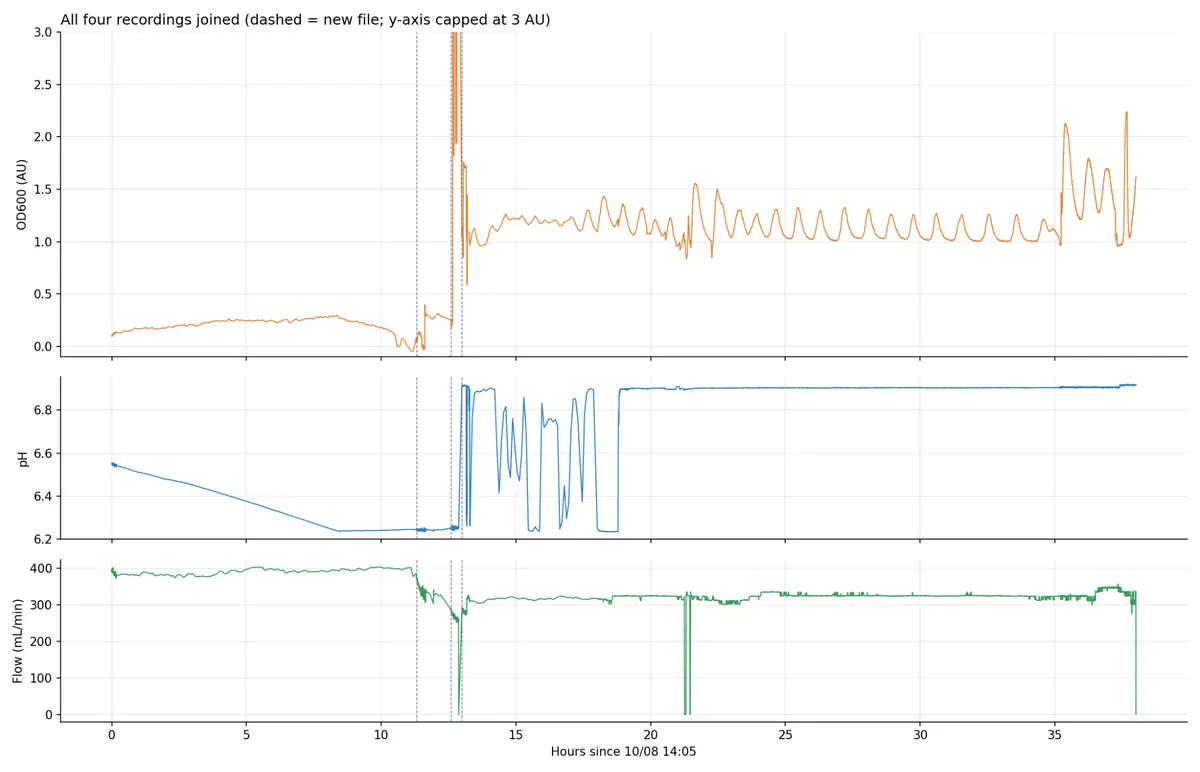
The pH and OD readings were unstable throughout, so the run was stopped early (37.5 h logged, in four files). ACC deaminase was measured on both sides by two assays. The DNPH assay measures enzyme activity by detecting the α‑ketobutyrate released when ACC deaminase breaks down ACC; we adopted it on Prof. Chang’s advice to show that the protectant is made (6.1). The ELISA measures the amount of protein. The pressure transducers read stably in this run.
The ELISA measured ACC deaminase and the team’s two other protectants, LEA14 and BoPep4, in medium from both sides. Each read about the same on the shell side as in the lumen: ACC deaminase 10.5 against 10.7 µg/mL, LEA14 5.9 against 5.8 µg/mL, and BoPep4 5.4 against 6.2 µg/mL (chart below). This is consistent with the protectants crossing the membrane at close to the culture’s concentration.
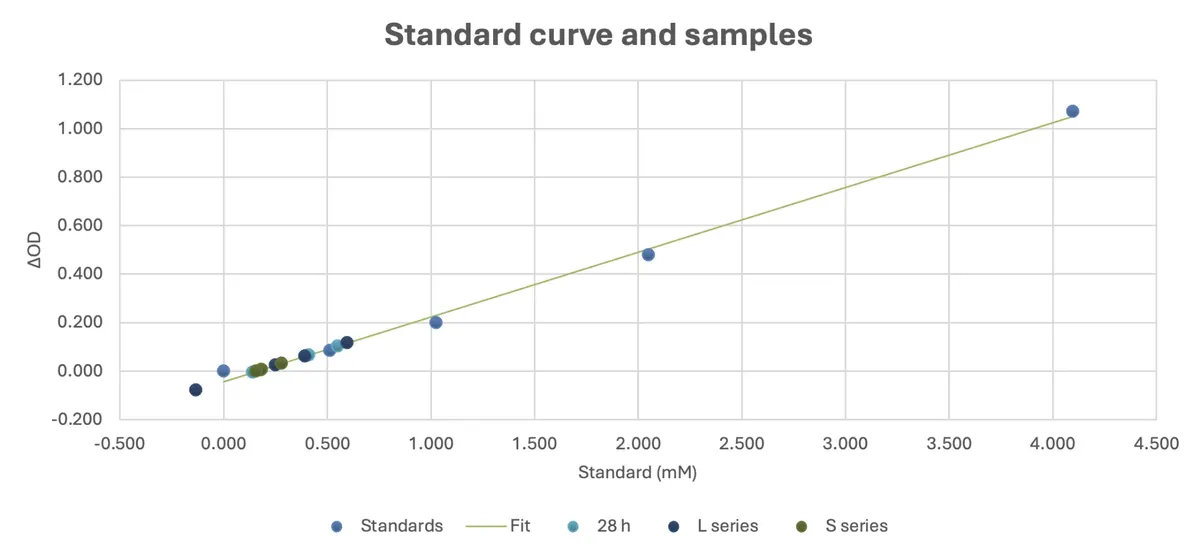
The DNPH assay detected ACC deaminase activity on both sides, as α‑ketobutyrate read from its standard curve (time course below). Shell‑side values stayed between 0.16 and 0.29 mM across four samples; lumen values ranged from 0.25 to 0.60 mM over the first 24 h. The readings lie at the low end of the standard range (0 to 4.1 mM), and the 40 h lumen sample reads below zero (−0.13 mM), so these activity values are approximate.
The DNPH standard curveStandards 0–4.1 mM; the samples at the low end
Learn
The bacteria made ACC deaminase in the loop, about 10 µg/mL by ELISA in one run, and the DNPH assay found activity on both sides. Because the shell side held about as much of each protectant as the lumen side (ELISA above), later runs sample only the shell side, which lowers the contamination risk. The pH shifted during the run, which needs confirming; few bubbles formed in the medium reservoir, so we suspect oxygen limitation and returned to 500 mL in the next run. The pressure transducers read well and needed no further change.
Prototype 3 of 3
Prototype 3 – KOH & Clean‑in‑Place
pH held with KOH; the loop cleaned in place
Design
Prototype 2 left the medium too acidic. A pH of 6.5 or lower impairs B. subtilis growth and cell division and the structural stability of the protectant enzyme, so the medium needed a way to be brought back up. The pH probe stayed on the lumen side, and KOH was added whenever the pH dropped.
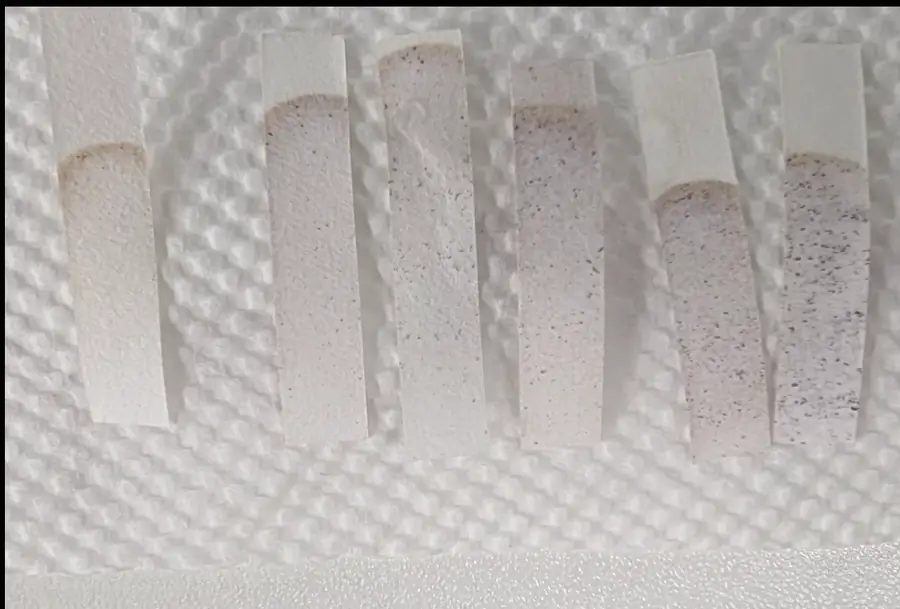
We also developed chemical clean‑in‑place (CIP) to sterilize the assembled loop without an autoclave. After assembly, 900 mL of distilled water and then 100 mL of 35% hydrogen peroxide are pumped in, mix in the lumen reservoir and circulate for 15 minutes; a starch–iodide test paper checks for peroxide. The solution is drained through a tube, which is then reattached to close the loop. Distilled water (1 L) then circulates for 30 minutes per wash, with a fresh test paper after each wash, until no peroxide remains; this usually takes five 1 L washes.
Build
The build followed prototype 2, on the same strain (B. subtilis WB800), with one change. We attributed the acidity to oxygen limitation, so the reservoir volume went from 1 L to 500 mL: the same surface for oxygen diffusion serves fewer bacteria. The notebook records that permeate was also halved to 12 mL/min and that the photometer’s acceptance gate was running (notebook, week 33).
Test
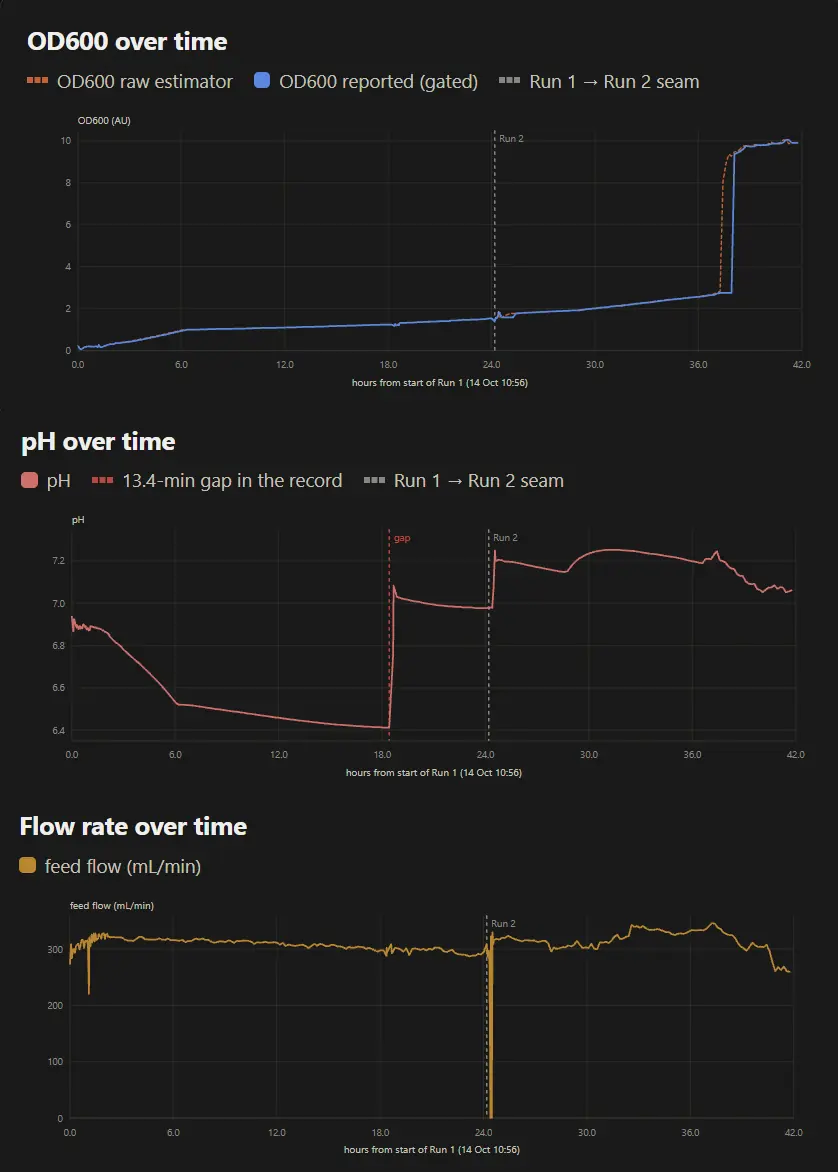
The run started on 14 October 2026. Protectant was drawn from the shell side at hours 1.10 and 18.38. At the 38‑hour mark a Luer valve at the start of the lumen loop broke in half, unnoticed at the time, and medium leaked into the incubator. Before that point the pH and OD curves were reliable, showing growth and the pH response to growth and to KOH. OD600 rose from 0.14 to 2.71 by 37 h, a fitted growth rate of 0.286 h−1 (notebook, week 33). This is inside the range forecast before the run: on 1 October we registered a growth rate of 0.2986 h−1, with a pass if the fitted rate fell between 0.2705 and 0.3300 h−1 (notebook, week 31).
Learn
The broken valve was traced to the clean‑in‑place step. We had assumed that 35% hydrogen peroxide would be diluted once it mixed in the reservoir, but it passes through the rest of the loop before it is diluted.
Adding KOH by hand during growth showed how long the medium takes to rebalance and how far the pH shifts in the bioreactor. These data will be used to build automatic pH correction.
Results
5.1 ACC Deaminase on the Output Side
In the second integrated run, ELISA found ACC deaminase at about the same concentration on the shell (output) side as in the lumen: 10.5 against 10.7 µg/mL.
What We Measured
Prototype 1, B. subtilis 168: a western blot of samples from 14 to 44 h showed a faint band at the size of ACC deaminase (~42 kDa) in shell‑side medium (blot in 4.2). This strain made barely detectable enzyme, and later runs used B. subtilis WB800 (prototype 1, Learn).
Prototype 2, B. subtilis WB800: by ELISA, ACC deaminase read 10.7 µg/mL in the lumen and 10.5 µg/mL on the shell side; LEA14 read 5.8 and 5.9 µg/mL, and BoPep4 6.2 and 5.4 µg/mL (chart in 4.2). The DNPH assay detected ACC deaminase activity on both sides, 0.16 to 0.29 mM on the shell side; these values are approximate (4.2).
What It Shows
The engineered cells make ACC deaminase in the closed loop, and the protein reaches the product side at close to the culture side’s concentration. This is consistent with the protectant crossing the fiber wall while the cells stay behind it; shell‑side medium grew no colonies in two platings (8). The evidence is from one run, which was cut short (4.2, prototype 2), and the activity readings are approximate.
Adjusting to Feedback
Many hardware changes between cycles came from two outside reviewers. Prof. Chang Jo‑Shu reviewed the bioreactor design on 18 June and 4 September 2026, and Teacher He of Owl Lab, a robotics lab, reviewed its electronics on 20 and 22 September. Each entry below ends with the build change it led to. Three other experts shaped the design earlier (6.3).
6.1 Prof. Chang Jo‑Shu
Prof. Chang (張嘉修), Chemical Engineering, National Cheng Kung University, is an expert in biomanufacturing. Both meetings were in person.
Prof. Chang 18 June first meetingNo force drove the protectant across the membrane; also its size and how to see fouling
Transmembrane pressureThe largest gap he found: nothing in the design drove the protectant from the lumen side, where it is made, to the shell side, where it leaves the membrane. A higher flow rate only recirculates the fluid and builds no outward pressure. He recommended a valve after the membrane to build pressure, and narrower tubing to concentrate it.
MembraneOur membrane may be oversized, which raises the risk of cells adhering to or clogging the fiber walls; he recommended a smaller one. Flow rate and transmembrane pressure should be monitored because they reveal fouling (caking). He also asked why we chose hollow fiber, which we could not yet justify.
ChangedA pinch valve, designed the next day around a stepper motor and switched to a servo in August (notebook, week 23), holds a transmembrane pressure that pushes product to the shell side (4.2, prototype 2). Three pressure transducers and a flowmeter on the lumen side are the fouling readouts; they produced the ΔP–Q relationship and the operating point (4.1). A smaller membrane replaced the first: the growth runs used a 30 cm module in a 6.3 cm housing, about 1.3 m², and the integrated runs a 60 cm module in a 1 cm housing, 200 cm² (10.1), with the same 0.2 µm, 1 mm fibers (notebook, week 24). The case for hollow fiber is in 2.2.
Prof. Chang 4 September second meetingRepeat the 22 °C growth, prove production, make the culture a swappable capsule
Growth at 22 °CGrowth of B. subtilis at 22 °C had been inconsistent, in the first test and again with the engineered strain (photometer page, 2). He suggested contamination or a strain trait, asked whether we had tested plasmid stability, and advised repeating the experiment.
Proving productionWe needed a way to confirm that the protectant is released. B. subtilis cannot carry a fluorescent marker for this and full quantification may cost too much, so we discussed a DNPH assay, hydroponic testing and colour indicators a farmer could read by eye.
Farmer useHe asked for usability and AIoT integration. For deployment the bioreactor should be modular, ideally with the B. subtilis supplied as a replaceable capsule and no hands‑on technical control. He also advised plainer wording for farmers and linking the project to the SDGs.
ChangedWe adopted the DNPH assay and ran it with the ELISA on both sides, so that activity and protein amount are measured together (4.2, prototype 2). The 22 °C pattern did not recur in the next run; the plateau and regrowth are in 4.2, prototype 1. The capsule is future work, as the planned sealed refill cartridges (9.2.5).
6.2 Teacher He, Owl Lab
Owl Lab is a robotics and electronics teaching lab. With the bioreactor nearly built, we asked Teacher He to review the hardware and find weak points before they caused problems in an experiment.
Teacher He, Owl Lab 20 September first meetingServo driver and torque, power supply, board layout: three faults, all fixed before prototype 2
Servo controlWe had planned a PCA9685 driver board for the servos that turn the Luer and pinch valves. In his experience it is unreliable: commanded to 90°, it may stop at 85°, and a valve that misses its position can cause a pressure spike that ruptures the tubing. Our chosen servos also lacked the torque. He suggested the STS3215 servo over UART, which has the torque and accuracy (22 USD each).
Power supplyOur plan powered everything through an AMS1117 module, stepping 12 V down to 5 V for most sensors and 3.3 V for the UNO Q. With valve and pump control added, the load exceeds its current rating, so a higher‑current module was needed.
Control boardThe Arduino UNO Q uses 3.3 V logic instead of the usual 5 V, so the pumps, motors and sensors need level shifting. He confirmed that the UNO Q should remain the main board and suggested a second board, an Arduino Mega 2560, to drive the pumps and valves. This keeps high‑current parts off the main controller and away from voltage‑sensitive sensors such as the pressure transmitters.
ChangedThe PCA9685 was dropped for STS3215 servos over UART, which drive the pinch valve added in prototype 2. The AMS1117 supply was replaced by the mainboard’s own 12 V to 5 V and 3.3 V converter, which gives the pumps and valves the current they need. The two‑board plan was superseded two days later by the mainboard, built to meet the same isolation requirement (next entry).
Teacher He, Owl Lab 22 September a better planOne mainboard in place of two boards and a tangle of wires
MainboardTwo boards would have meant a bulky package with long wire runs. Instead, one mainboard carries a converter from 12 V to 5 V and 3.3 V and brings out every UNO Q pin, so it acts as an extended UNO Q. A jumper sets each pin to any of the three voltages, so any pin can serve any sensor, and the loose wiring of the old design becomes swappable modules.
ChangedThe two‑board design was dropped and the mainboard built (4.2, prototype 2). It supplies the current the AMS1117 could not, keeps the 3.3 V UNO Q apart from the pumps and valves, and, with the transducers moved to 12 V and grounded on the DC–DC module, ended the unstable pressure readings of prototype 1: by prototype 2’s Test they read stably. Its modular sensor ports let the pH probe and the pinch‑valve motor be added without rewiring (7.1.3).
Two points from these reviews changed the photometer. Prof. Chang noted that samples above OD600 1 must be diluted to read accurately, which entered our measurement protocol (photometer page, 5.2). Owl Lab’s mainboard led us to rebuild the photometer as a plug‑in module (photometer page, 9.2). Both are described in the photometer page’s Adjusting to Feedback.
6.3 Other Reviewers
Prof. Chen Wen‑Liang 10 AprilKeep the bacteria in a vessel, and sell the consumable
AdvisedDrop soil‑moisture sensing: cheap sensors already dominate that market, and calibrating across soils takes three to four months of data per soil type. Engineered bacteria released into open soil are hard to defend; keep them in a vessel, and sell the consumable, not the device.
ChangedA contained vessel in place of release into soil, which became this bioreactor (2.1), and the refill‑cartridge plan (9.2.5).
Dr. Jennifer Brophy 18 AprilPhysical containment first, not a kill switch
Mr. Riddler Lu 13 OctoberConnect to the farm’s irrigation; add rain and conductivity sensors
AdvisedAdd rain and conductivity sensors, and train the forecast on the area’s history. A unit that does not connect to the farm’s irrigation leaves the farmer to collect and apply the protectant by hand.
ChangedThe planned water supply and irrigation line (9.2.7).
Outside reviewers changed the loop’s structure: a membrane in place of a kill switch, a valve to drive the protectant out, instruments to signal flow and fouling, and one mainboard in place of loose wiring.
Final Designs & Specifications
The final design came in two steps. The lab bioreactor is the setup we built and ran, with every part exposed so it could be measured, sampled and changed between cycles. The commercial bioreactor is the product a farmer would buy: it keeps the lab bioreactor’s loop and encloses everything else. In both, the bacteria stay in a closed loop on the lumen side of a hollow‑fiber membrane, and only what they secrete crosses to the shell side.

7.1 Lab Bioreactor: What We Ran
We built the lab bioreactor on a 600 × 900 mm wire‑grid panel standing on two L‑bracket feet. The membrane stands upright in the middle as a column, with the culture loop on its left and the protectant line on its right, so every part can be reached and every tube traced by eye.
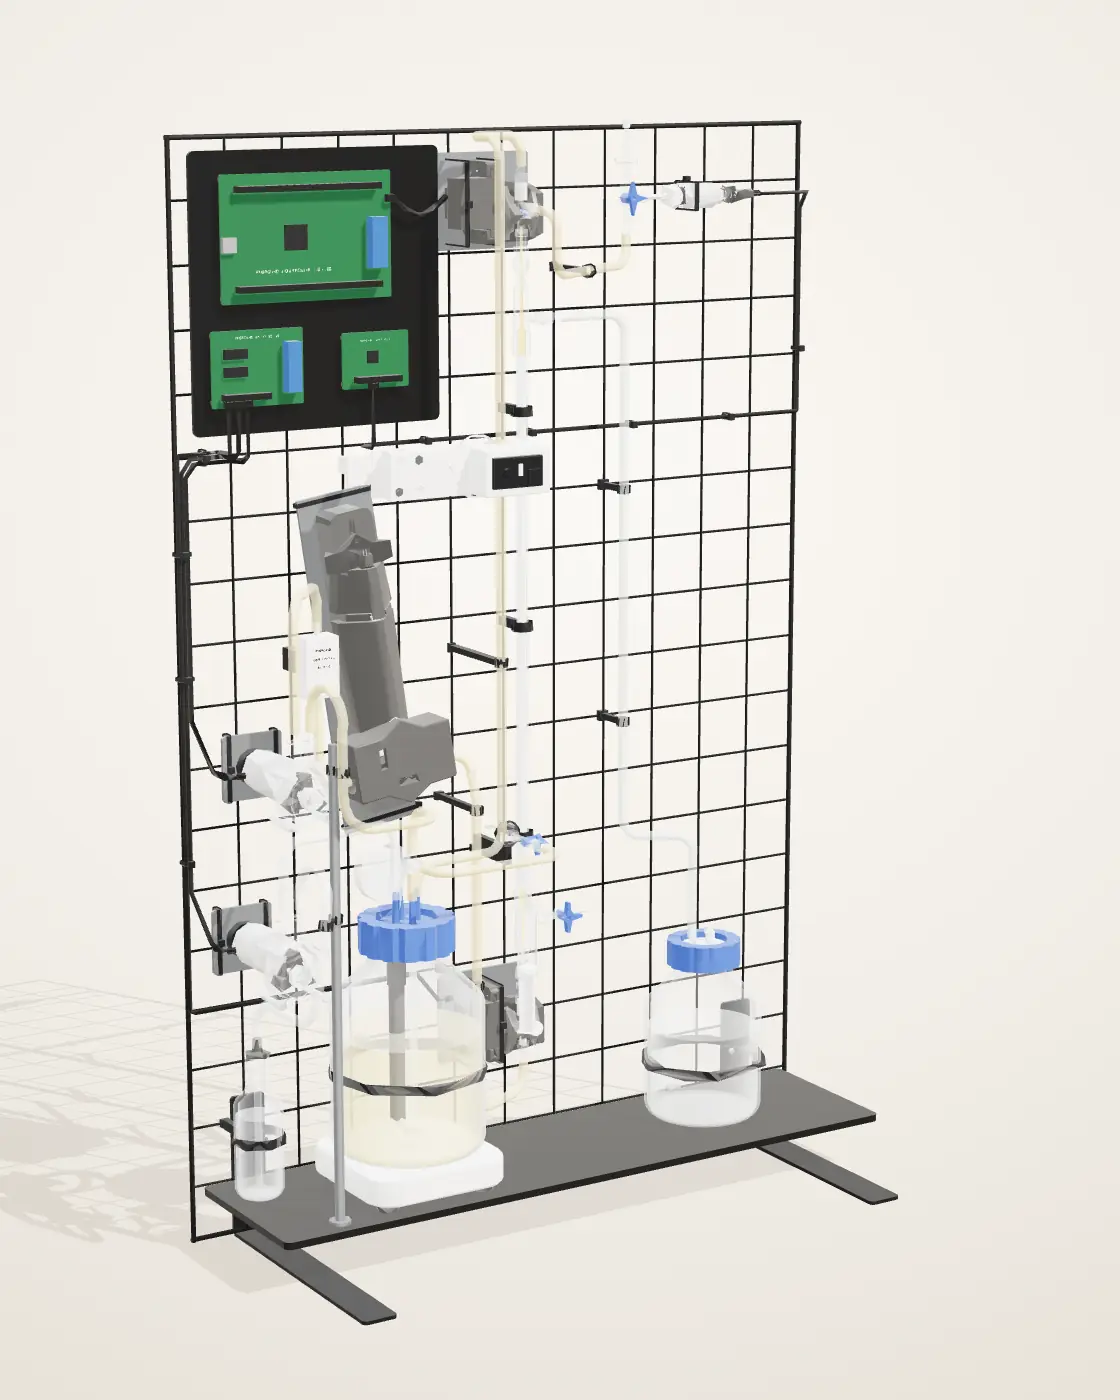
7.1.1 Specifications
- Mounting
- 600 × 900 mm wire‑grid panel on two L‑bracket feet; the bottles stand on an acrylic shelf
- Membrane
- Cobetter MiniLab hollow fiber: mPES, 0.2 µm pores, 200 cm², 11 fibers
- Volume
- A 1 L bottle: 1 L of culture in integrated prototype 2, 500 mL in prototypes 1 and 3
- Culture flow
- By a peristaltic pump: 94 mL/min in the June growth runs; a feed flow of about 300–390 mL/min in integrated prototypes 2 and 3 (their traces); 263 mL/min recommended by the membrane cycles (4.1)
- Stirring
- Magnetic stirrer at 200 rpm
- Temperature
- 37 °C for the growth curve; 22 °C for the photometer’s 434 h logged run
- Sensing
- In‑line photometer (OD600); three pressure transducers, at feed, retentate and permeate; a flowmeter; a pH probe in the bottle cap
- Control
- Four servo‑driven Luer valves and one servo pinch valve, on the return line; KOH dosing for pH
- Expression
- 3 m green LED strip: CcaS/CcaR, ~535 nm on, ~670 nm off
- Tubing
- Silicone, 4 × 6 mm and 5 × 7 mm, 50A
The partsnumbered as in the model
Culture loop 1–8
- 1Culture bottleOn its magnetic stirrer, with an air filter on the cap.
- 2Culture pumpPeristaltic; drives the loop at 94 mL/min.
- 3Flow meterOn the culture line.
- 4In‑line photometerReads OD600 through the flowing culture.
- 5Servo valveAt the foot of the membrane column.
- 6Hollow‑fiber membraneThe cells stay in the fibers; what they secrete crosses to the shell side.
- 7Servo valveAt the top of the column, where the culture leaves the fibers.
- 8Pinch valveClamps the return line to set the pressure across the fibers.
Protectant line 9–10
- 9Protectant bottleCollects what crosses the fiber wall.
- 10Luer valveCloses the membrane’s lower shell port.
Also on the rack: the pressure transducer at the lumen outlet, the sampler, the KOH pump and bottle, the stirrer, the electronics plate, the shelf and the panel.
7.1.2 How the Rack Is Built
- Everything reachableParts hang on the wire grid, so any one can be moved or swapped without taking the rack apart.
- Bubbles out of the membraneThe membrane stands upright: the culture enters at the foot and gas rises out at the top valve.
- Traceable tubingEach tube has its own path, the culture loop on the left and the protectant line on the right.
- A stable standThe panel stands on two L‑bracket feet, and the heavy bottles sit low on the shelf.
7.1.3 The Soldered Boards
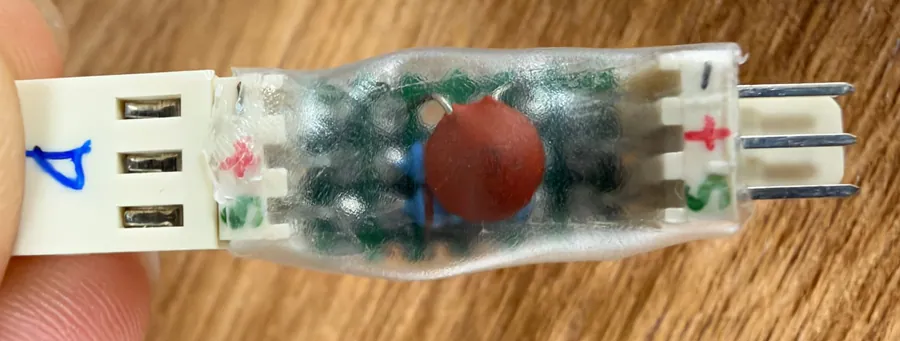
Two hand‑soldered boards run the lab bioreactor’s electronics: the controller board, which carries the sensor and servo ports, and a small adapter on the cable most of our sensors use, which steps the sensors’ 5 V signal down for the UNO Q’s 3.3 V input.


7.2 From the Lab to the Product
The lab bioreactor demonstrated the loop. The commercial bioreactor keeps that loop and changes everything a farmer would otherwise have to handle.
- Every part in the open, within reach of the cultureA closed cabinet that only our team opens
- Medium poured and the culture inoculated by handOur team installs, primes and inoculates each unit; nothing is poured on the farm
- Growth followed on a laptop dashboardA 7‑inch screen on the front and the same screen on a phone (7.3.2)
7.3 Commercial Bioreactor: What a Farmer Buys
The commercial bioreactor is our design for the product and has not been built: the lab bioreactor’s loop in a cabinet about 400 × 240 × 620 mm that stands beside the crop. Inside are the same two paths, the culture loop on the lumen side and the protectant on the shell side. Our team installs, primes and inoculates each unit; day to day, the farmer only reads the screen.
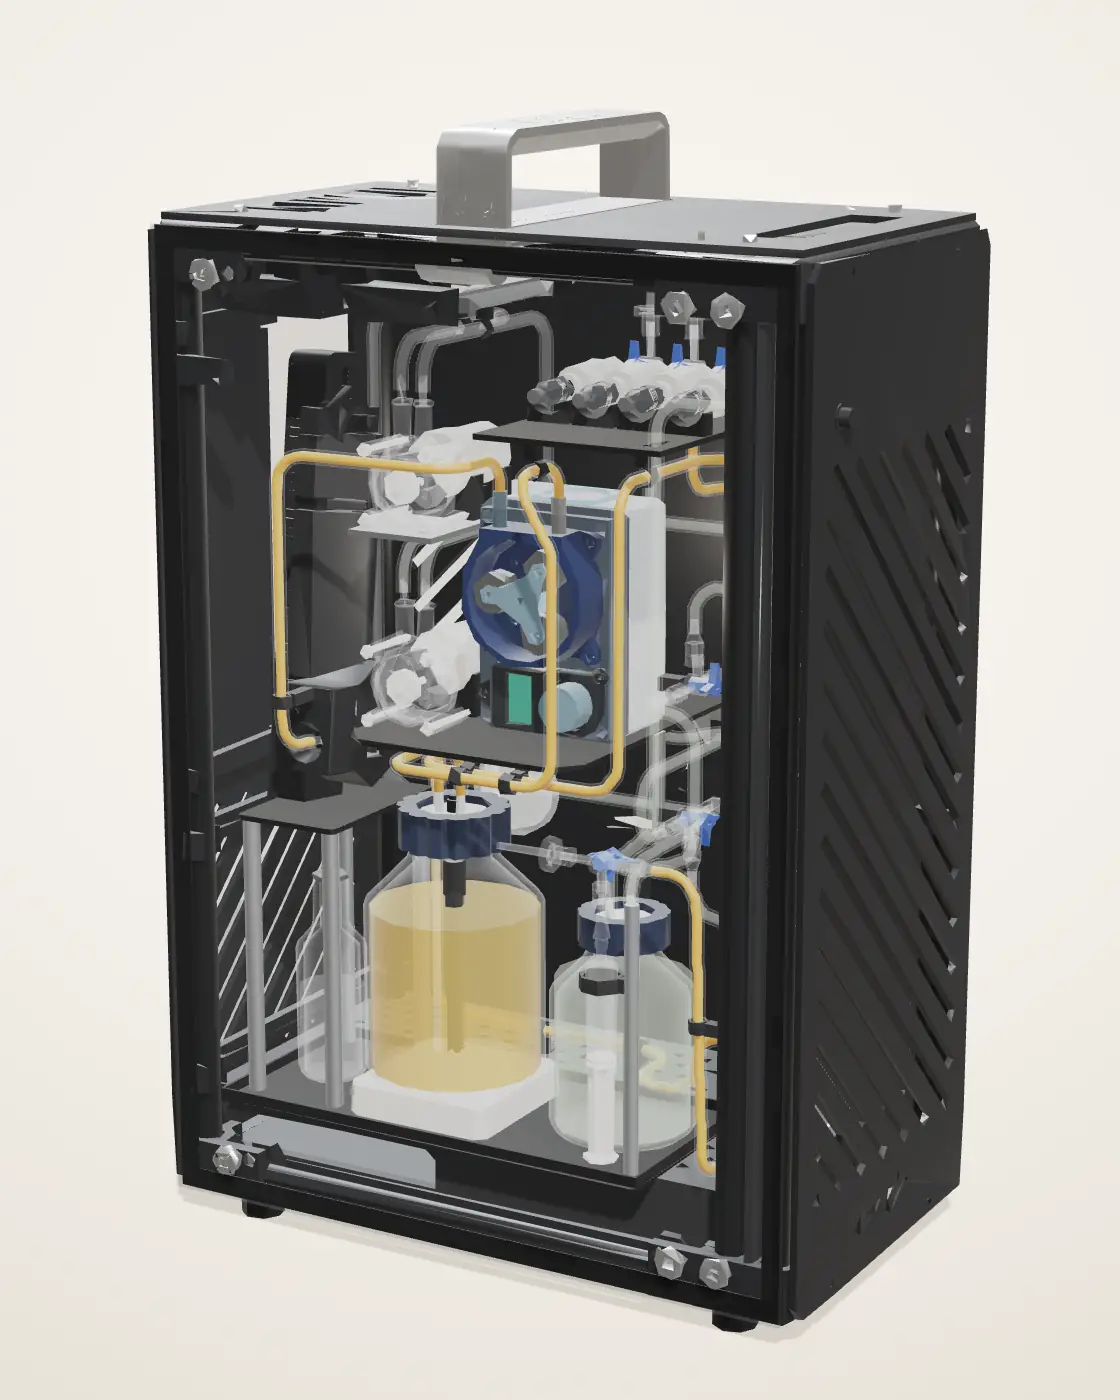
7.3.1 Specifications
- Size
- About 400 × 240 × 620 mm (W × D × H)
- Culture loop
- Stirred vessel → peristaltic pump → in‑line photometer → membrane fibers → back to the vessel
- Protectant
- Membrane shell side → protectant bottle → outlet to the field
- Volume
- 1 L, as in the lab bioreactor
- Sensing
- In‑line photometer (OD600), four pressure sensors around the membrane, pH and temperature probes
- Control
- Servo valves on the membrane’s lines; KOH dosing to hold the pH
- Interface
- A 7‑inch touchscreen on the front; the same screen as a phone page over the farm’s Wi‑Fi
The partsnumbered as in the model
Inside 1–10
- 1Peristaltic pumpsMove the culture round its loop and the protectant out.
- 2In‑line photometerReads OD600 as the culture flows past.
- 3Hollow‑fiber membraneThe cells stay in the fibers; what they secrete crosses to the shell side.
- 4Culture vessel1 L, stirred, temperature held.
- 5ProbespH and temperature, in the vessel’s cap.
- 6Protectant bottleCollects what crosses the fiber wall.
- 7KOH bottleBase, to hold the culture’s pH.
- 8Servo valvesOpen and close the culture’s way through the membrane.
- 9Pressure sensorsFour, one at each membrane port.
- 10OutletWhere the protectant leaves for the field.
Case parts, not numbered: the smoked‑glass door, the top panel with its handle, the side and end panels, and the frame.
7.3.2 Screen and Phone
The screen shows at a glance whether anything needs doing: the run state, the culture’s density, acidity and temperature, the light and the pumps, and one banner that reads either all normal or the action required. The same interface runs in our digital twin: Digital Twin →
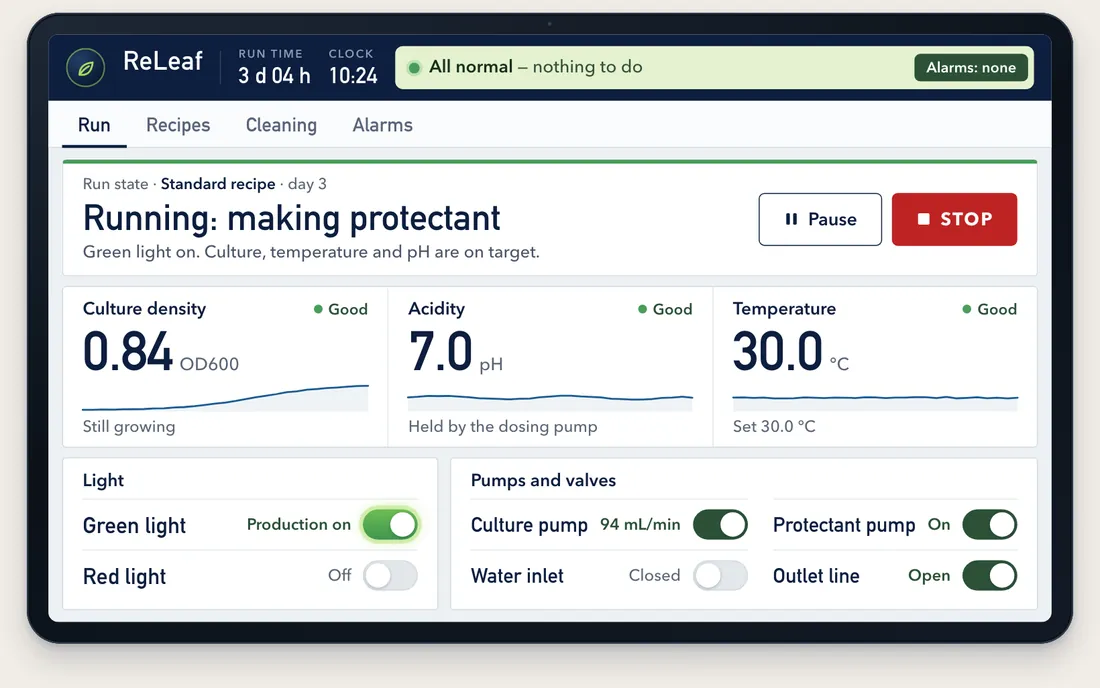
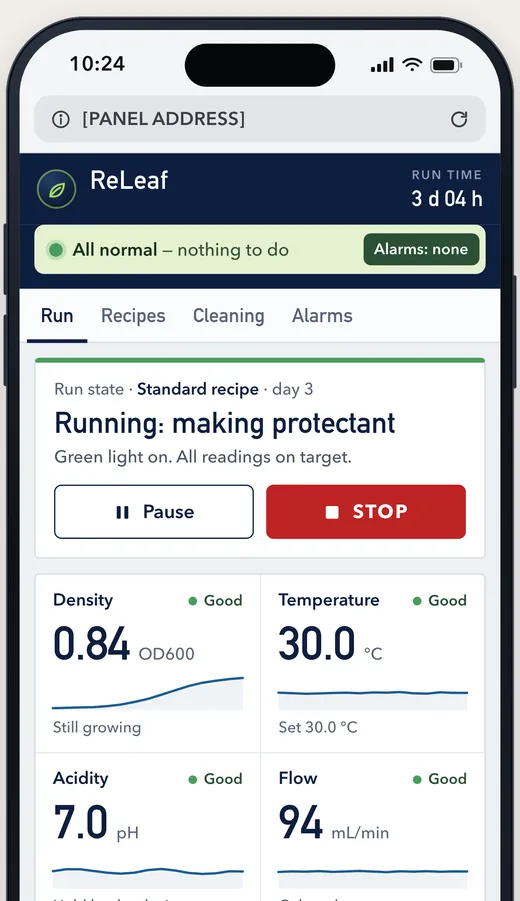
- 1Run stateWhat the unit is doing, and the day of the run
- 2Culture densityOD600 from the in‑line photometer, with its trend
- 3Status bannerAll normal, or what to do
Containment & Safety
Keeping genetically modified organisms out of the environment is the first priority of the ReLEAF bioreactor.
What gets through the membrane wall
ModelTo check that the membrane retains the bacteria, we collected medium from the lumen and shell sides during a run, plated both, and compared the plates after 24 h at 37 °C.
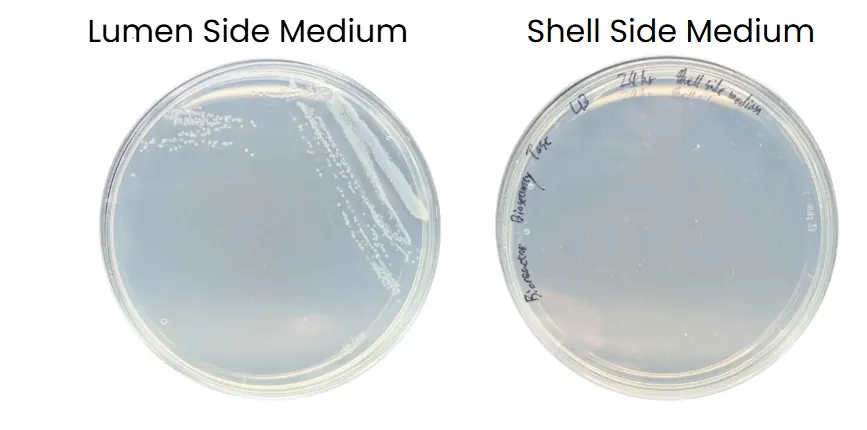
Colonies grew from the lumen side and none from the shell side: in this test the membrane retained B. subtilis and kept it out of the medium that leaves the machine. A second plating, of shell‑side medium from an earlier growth run, also grew no colonies (photometer page, 2.1).
A leak outside the membrane. In integrated prototype 3 a Luer valve at the start of the lumen loop broke in half at the 38‑hour mark, and culture medium leaked into the incubator (4.2, prototype 3). The failure was at the valve, not the membrane: the clean‑in‑place step’s 35% hydrogen peroxide reaches the valves before it is diluted in the reservoir (its Learn). The planned droplet sensor under the loop is meant to catch leaks of this kind (9.2.3).
Handling the peroxide. 35% hydrogen peroxide is a strong oxidizer that harms skin and eyes; it is handled with gloves and eye protection in a well‑ventilated space.
Successes & Future Plans
9.1 Demonstrated Success
-
Bacterial Containment
Shell‑side medium grew no colonies in either plating; the lumen‑side plate grew.
Plates, part 8 -
Protectant Transfer
ACC deaminase on the shell side at about the lumen’s level, by ELISA.
Prototype 2, 4.2 -
Bacterial Growth
OD600 0.14 to 2.71 in 37 h in integrated run 3, at 0.286 h−1, inside the range forecast before the run.
Prototype 3, 4.2 -
Closed‑Loop Operation
OD600 read in line; the loop logged OD600, flow and pressure through a 116 h run.
Dashboard, 4.2
9.2 Future Plan
9.2.1 Containment in Layers
In normal operation the bacteria are contained: the membrane’s 0.2 µm pores are smaller than any B. subtilis cell, and shell‑side medium grew no colonies in two platings (8). For the commercial bioreactor we plan two further layers around the membrane, each catching a failure the other cannot detect. The first uses hardware the bioreactor already has; the second adds one sensor.
Pressure comes first because it needs no new parts and acts before anything escapes. The droplet sensor catches what pressure cannot: fluid escaping outside the loop.
9.2.2 Layer 1: Pressure Alarm and Pump Stop
The lab bioreactor measures pressure at three membrane ports and computes the TMP on the dashboard (4.2); the commercial design reads all four (In‑Lumen, Out‑Lumen, In‑Shell, Out‑Shell). These numbers are currently only displayed. We will program the controller to act on them: above a set threshold on lumen pressure or TMP, the system sounds an alarm, stops the culture pump and opens the pinch valve to relieve the pressure.
The lab bioreactor measures pressure at three membrane ports and computes the TMP on the dashboard (4.2); the commercial design reads all four (In‑Lumen, Out‑Lumen, In‑Shell, Out‑Shell). These readings are currently only displayed, and the controller will be programmed to act on them.
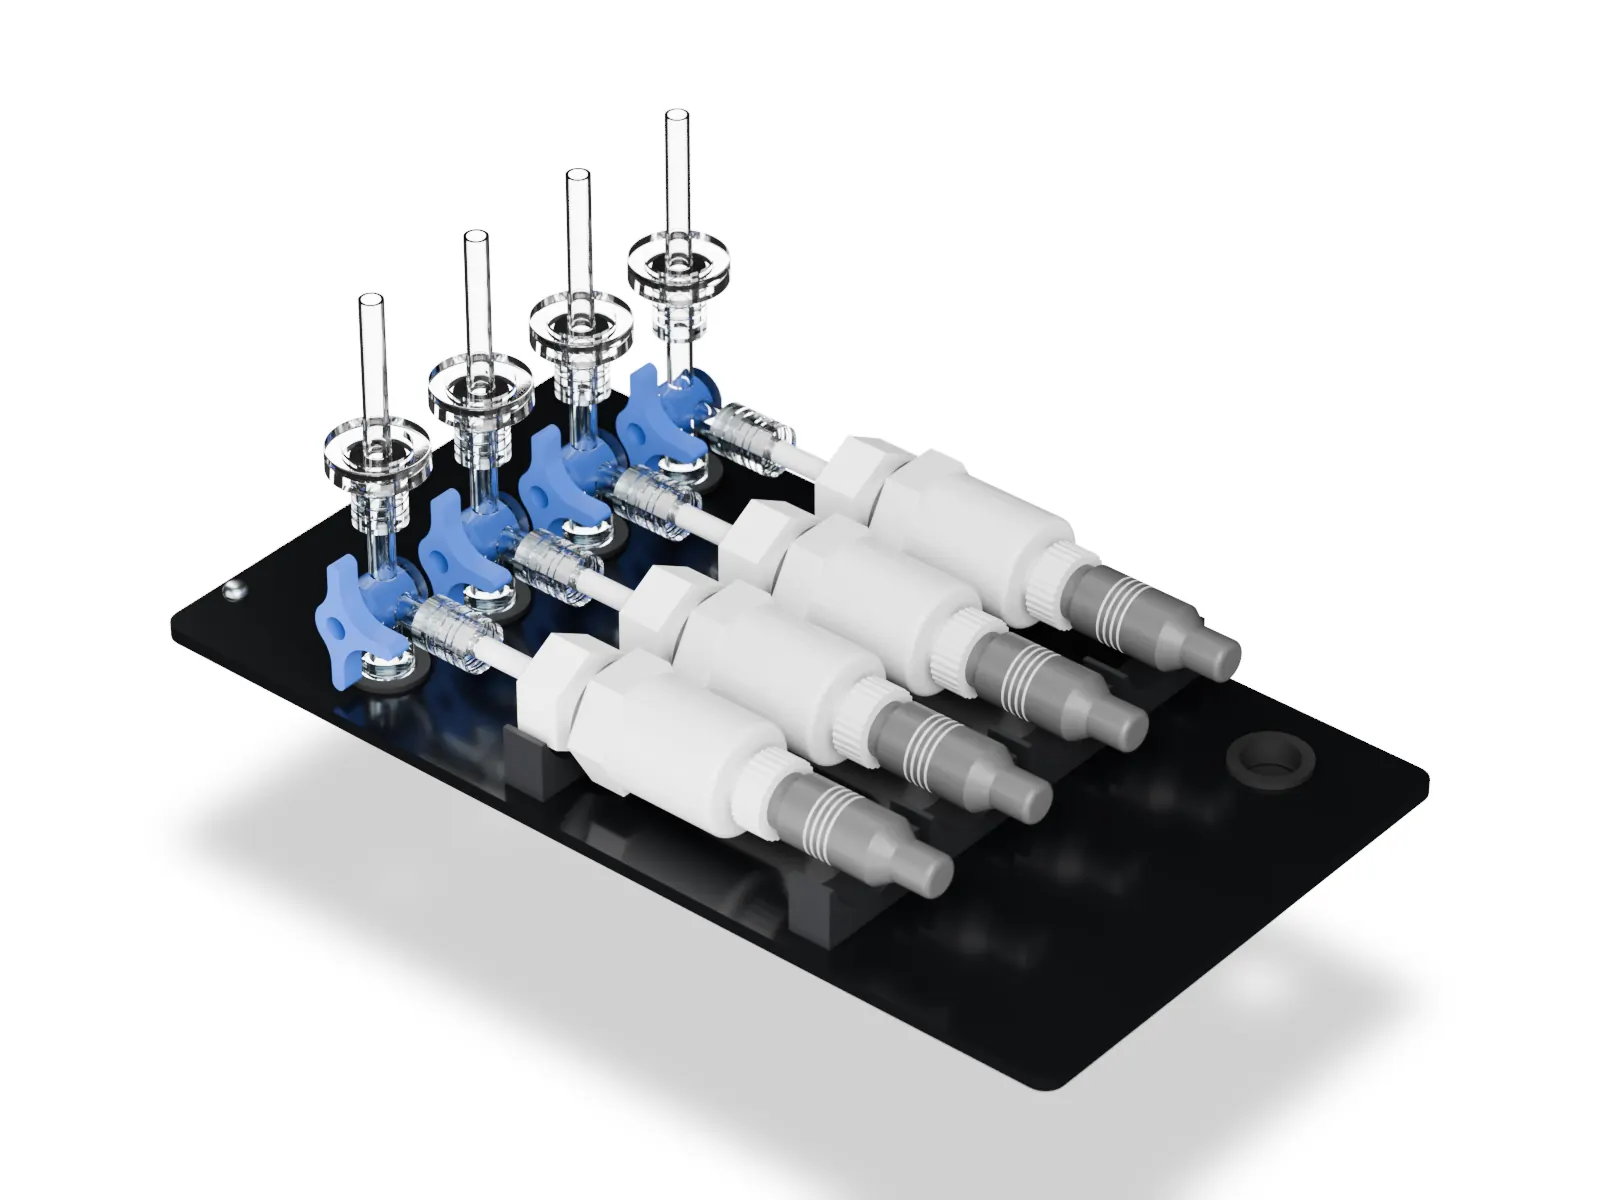
Four pressure ports, two alarms
Model PlannedThis card runs a small model of the module’s four pressure ports and the two planned alarms in the browser. On the 4 September dashboard, feed, retentate and permeate each read about 0.20 bar.
The plan
- Sensors
- The four pressure transducers already fitted, one at each membrane port
- Trigger
- Lumen pressure or TMP above a threshold for several readings in a row, or a sudden drop
- Action
- An alarm on the screen and the phone page; the culture pump stops; the pinch valve opens to relieve the pressure
- Reset
- By hand, once the cause is found; no automatic restart
- New hardware
- None: a firmware change only
9.2.3 Layer 2: Droplet Sensor under the Loop
The first layer monitors fluid where it should be; the second monitors where it should not be. A droplet sensor beneath the loop will detect liquid escaping from tubing or connections, so a slow leak from a loose fitting cannot continue unnoticed.
The plan
- Sensor
- A droplet (moisture) sensor at the low point of a drip tray under the loop
- Trigger
- Any moisture on the sensor
- Action
- An alarm; the pumps stop
- New hardware
- One sensor and a drip tray
9.2.4 How the Layers Work Together
Each layer answers a different failure, and both end the same way: the alarm sounds, the pumps stop, and nothing restarts until a person has found the cause.
9.2.5 Sealed Refill Cartridges
Over a season a farmer must replenish both medium and culture, and neither is safe to do by hand. The commercial bioreactor therefore takes two sealed, single‑use cartridges: ready‑to‑use sterile medium, and a B. subtilis spore stock that ships at room temperature. Both fit one keyed dock: the medium cartridge has a D‑shaped collar and the spore cartridge a round one, so neither fits the other’s port.
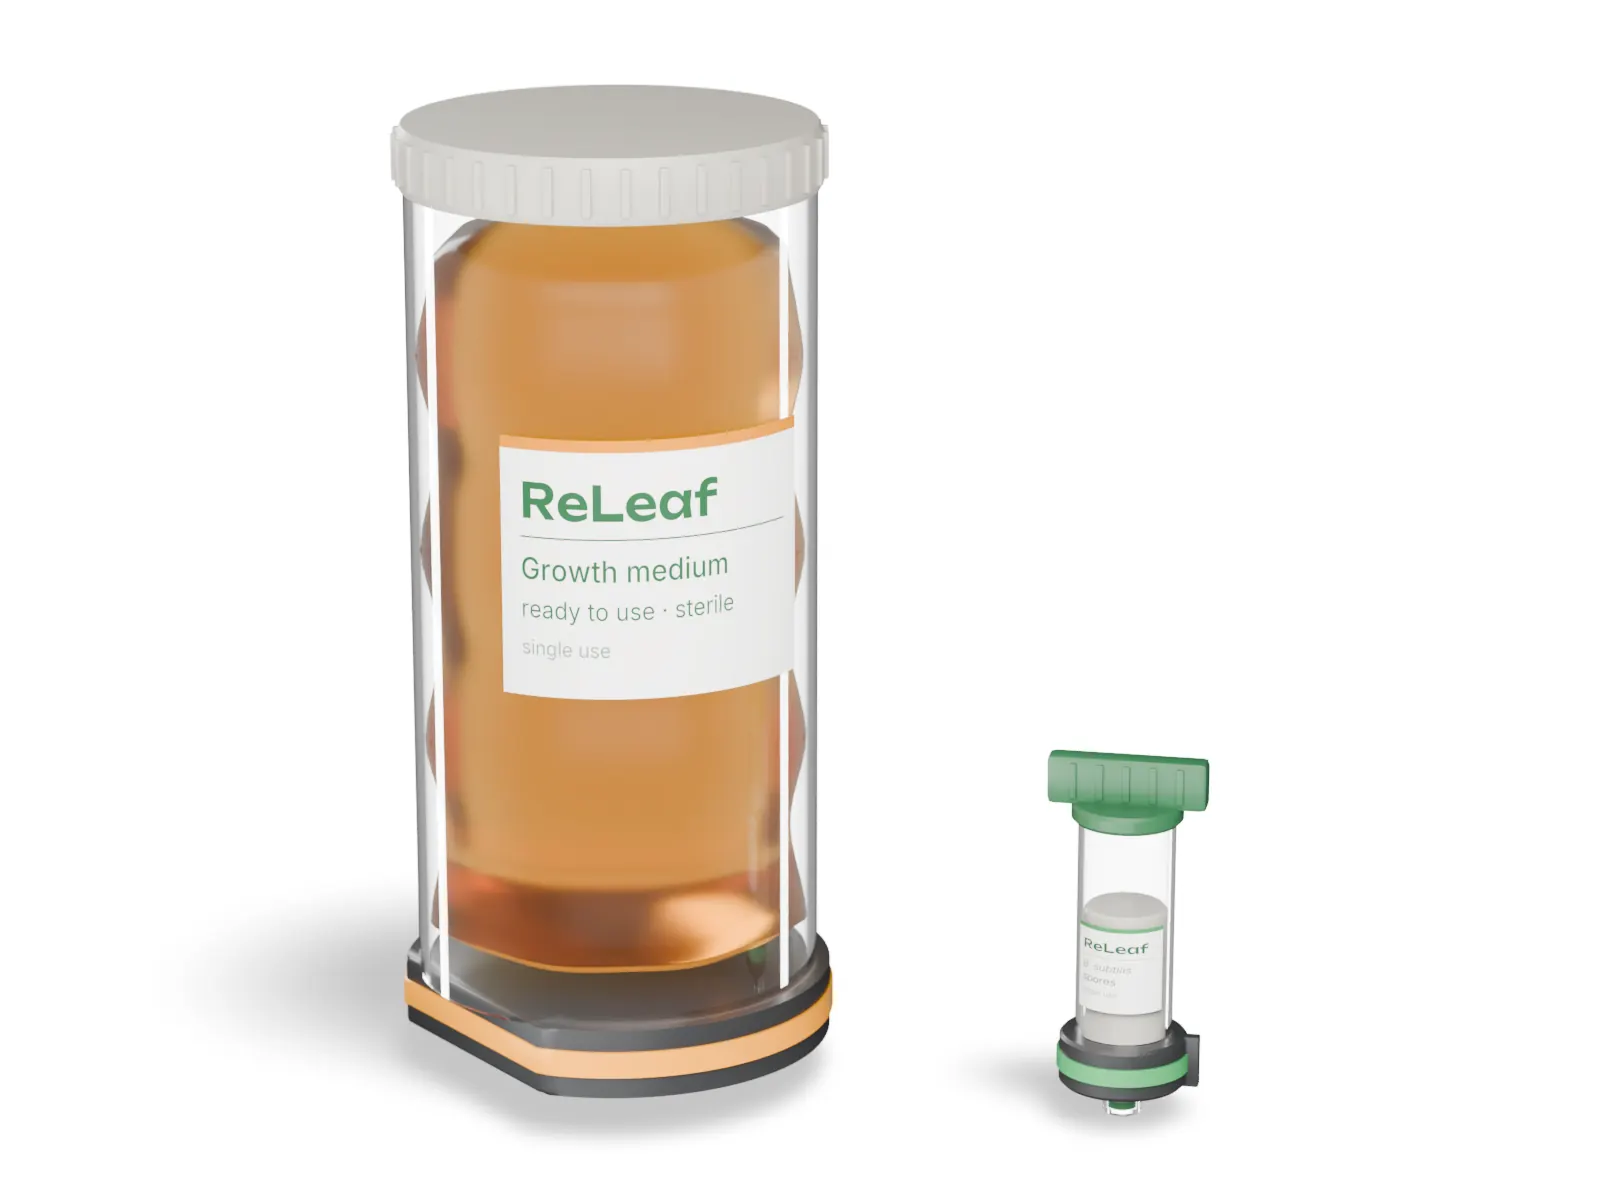
A valve in each cartridge’s base stays shut until the cartridge is seated and closes as it is lifted out, and the medium bag collapses as it drains, so no vent is needed. Medium goes in first, then the spores. The cartridges are the only part a farmer handles: our team installs, primes and inoculates the bioreactor, and spent cartridges return sealed.
Before a prototype, the cartridges need a reliable seal (our printed parts were not watertight, so moulded parts or O‑ring glands are needed), sterility over repeated changeovers, and confirmation that our strain sporulates and germinates reliably from stored spores.
9.2.6 Self‑Cleaning Purge
Each refill leaves spent medium and dead B. subtilis in the loop. A purge before new cartridges go in drives the farm’s water supply (9.2.7) at high pressure through the whole loop and out through a cleaning outlet into a waste cartridge in its own keyed slot. When the purge ends, the inlet valve closes, the cartridge is lifted off, and a shutter seals it, so nothing biological leaves the unit open.
The purge is the product version of the clean‑in‑place rinses run by hand on prototype 3 (4.2), and it keeps the cartridge rule: the farmer only handles sealed parts. Open questions are the pressure the loop and membrane can take, a check valve to stop dirty water flowing back into the supply, and whether a disinfectant step is needed between runs.
9.2.7 Water Supply and Irrigation Line
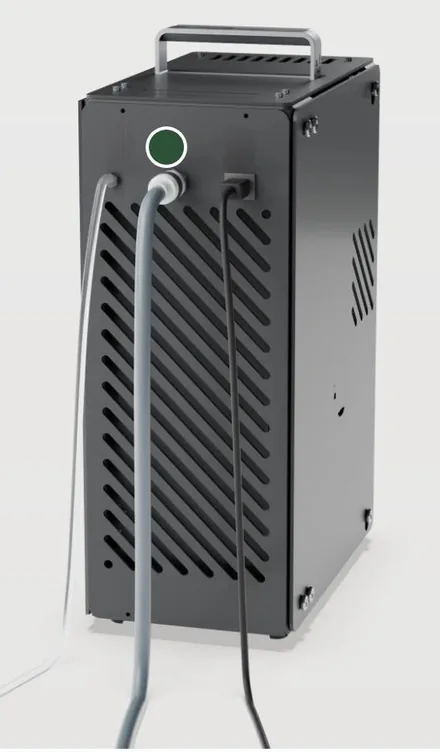
The commercial bioreactor will connect to the farm’s water supply. The protectant stream from the shell side is mixed with that water and pumped into the irrigation line, so the protectant reaches the roots with the irrigation water and the farmer adds nothing by hand.
 Water
9.2.8 Scaling
We would increase capacity by scaling out, not up: replicating the characterised module, as a vertical farm adds identical units. From one module to eight, the membrane does not limit capacity; the pumps, power and medium supply around it do, and a duty‑cycled pump would ease that.
Team wiki · Biomanufacturing · 8 Scaling One module to eight: what binds? Read the full scaling analysisReproduction
10.1 Materials List & Cost
| Part | Qty | Unit (US$) | Total (US$) |
|---|---|---|---|
| Luer valvesThree‑way stopcock, Fr6‑10 | 10 | 0.50 | 5.00 |
| TubingSilicone, 4 × 6 mm and 5 × 7 mm, 50A | 1 | 10.00 | 10.00 |
| FiltersHydrophobic PTFE disc vent filter, 0.45 µm | 5 | 10.00 | 50.00 |
| Pressure transducersBP8G‑AGB (Jingfeng), ceramic: 0–1 MPa gauge, 0–5 V out | 4 | 12.00 | 48.00 |
| pH sensorDFRobot Gravity analog pH V2, board and glass probe | 1 | 77.30 | 77.30 |
| Flow meterZJ‑TM02 | 1 | 2.00 | 2.00 |
| Reservoirs, 1 LSCHOTT bottle | 2 | 10.00 | 20.00 |
| Reservoir, ~100 mLSCHOTT bottle | 1 | 5.00 | 5.00 |
| Hollow‑fiber membraneCobetter Biophsep MiniLab: mPES, 0.2 µm, 200 cm², 11 fibers | 1 | 245.00 | 245.00 |
| Magnetic stirrerUSB, variable speed | 1 | 10.00 | 10.00 |
| Culture pumpZP4000‑N79H peristaltic, 1 L/min | 1 | 50.00 | 50.00 |
| Liquid pump1.5 L/min | 1 | 8.00 | 8.00 |
| Servo motorsSTS3215, 12 V: the pinch valve and the automated luer valves | 5 | 20.00 | 100.00 |
| Servo bus adapterBus serial servo adapter | 1 | 10.00 | 10.00 |
| M4 nutFor the pinch valve | 2 | — | — |
| M4 button‑head screwFor the pinch valve | 2 | — | — |
| SolderLead‑free; one roll serves all our hardware | 1 | 10.00 | 10.00 |
| In‑line photometer (Pro)The total of the photometer’s materials list | 1 | 371.78 | 371.78 |
| Filament25.81 g black PLA, for the printed pinch‑valve and luer‑valve parts (Bambu Studio) | 22.99/kg | 0.59 | |
| Total, known costs | 1,022.67 |
Prices from the team’s materials lists. The total, US$1,022.67, is about NT$33,000 at NT$32 to the dollar. Not costed yet: the pinch valve’s M4 nuts and screws. Not listed: the controller (Arduino UNO Q) and its mainboard with the DC–DC converter, the KOH dosing pump, and the stir bar. The list counts four pressure transducers; the lab rig runs three (feed, retentate and permeate).
10.2 Design Files
The bioreactor’s two printed parts, the boxes that hold its five servos. Each STL downloads under a descriptive name.
The two STLsone per printed part
- 1Pinch‑valve body
Holds the pinch valve’s servo, with an arm of four nut pockets; it clamps the return line.
- 2Luer‑valve servo mount, four of one part
The same servo box with a screw ear on each side; one turns each automated Luer valve.
10.3 Assembly Guide, Brochure & User Manual
Seven stages, from the photometer, the four port assemblies and the sensor adapter cable to the water run, sterilizing and blanking, with the parts list and a check after each. 10 pages.
The commercial bioreactor as a farmer would meet it: what it does, setting up, the screen, refills, running costs and specifications, for a design not yet built. 17 pages.
Installation, calibration, daily operation, maintenance, troubleshooting and disposal for the lab bioreactor, with the safety rules and a commissioning record. 16 pages.