Overview
In‑Line Flow‑Cell Photometer
A subsystem of the ReLEAF bioreactor.
The In‑Line Flow‑Cell Photometer is the optical‑density subsystem of the bioreactor. Medium from the lumen loop of the hollow‑fiber bioreactor passes through a flow cuvette with a 2 mm light path, where the optical density at 600 nm (OD600) is recorded continuously, without drawing a sample. We built two designs: the “Pro” photometer, used in lab testing, and the “Slim” photometer, tested in early October, which reduces cost while keeping its reliability, as its R² value shows. Reproduction (part 10) gives the CAD STL files for both, and the materials list and a shortened assembly guide for the Pro photometer, for readers who want to replicate this subsystem without the full bioreactor.
Before reading the culture with our own photometer, we established a growth curve of Bacillus subtilis 168 in the hollow‑fiber membrane (part 2).
Bacterial Growth
DBTL 1 of 2
2.1 DBTL 1 – B. subtilis 168 Growth through the Hollow‑Fiber Membrane, 22 °C
Prototypes I‑0606 and I‑0610 · 6–10 June 2026
Design
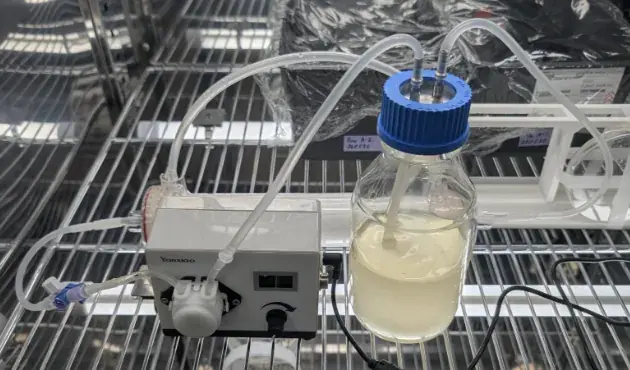
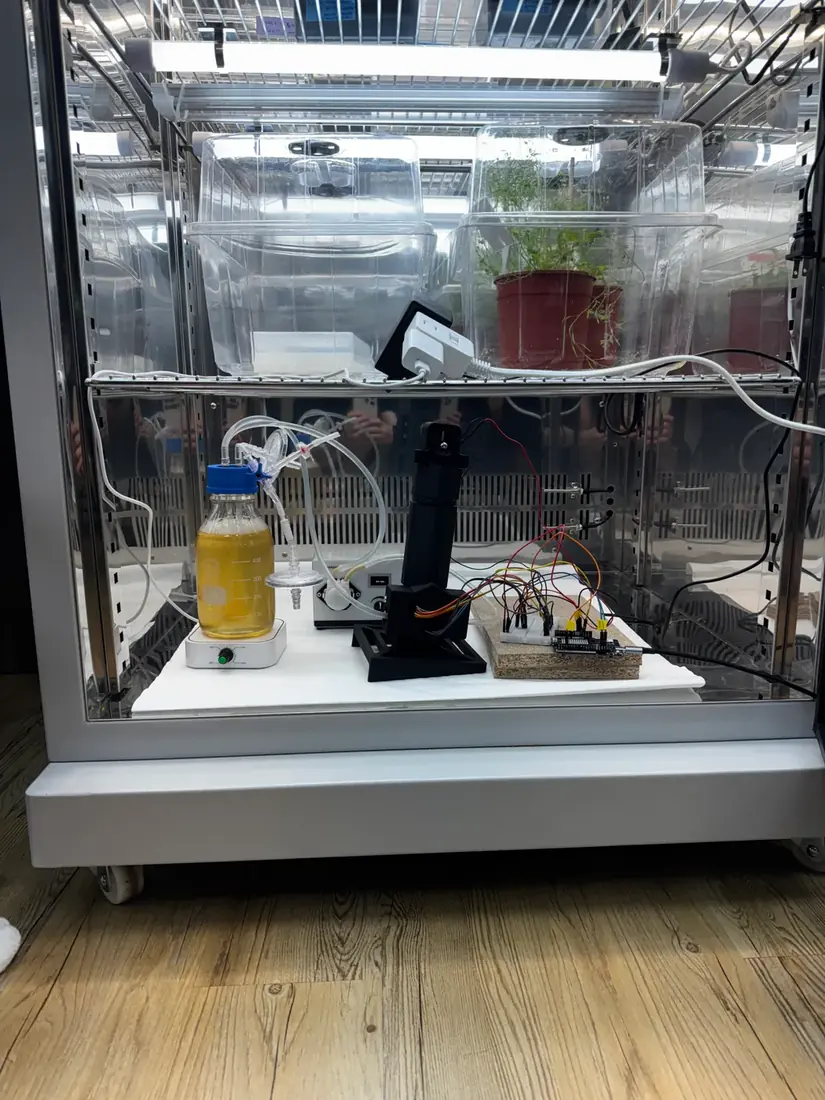
The objective was a functional continuous‑flow loop through a PES hollow‑fiber protein membrane (lumen volume ~200 mL), with a peristaltic pump, a Luer valve and a 500 mL reservoir containing 300 mL of LB medium, inoculated with 20 mL of a multi‑overnight B. subtilis liquid culture (the illustration below).

Build
After the pump of prototype I‑0606 leaked (Test, below), it was replaced by the LP01‑1S3*5, a pump with more durable tubing (prototype I‑0610), chosen over BPT tubing because it was available in our workspace and expected to be strong enough.
Test
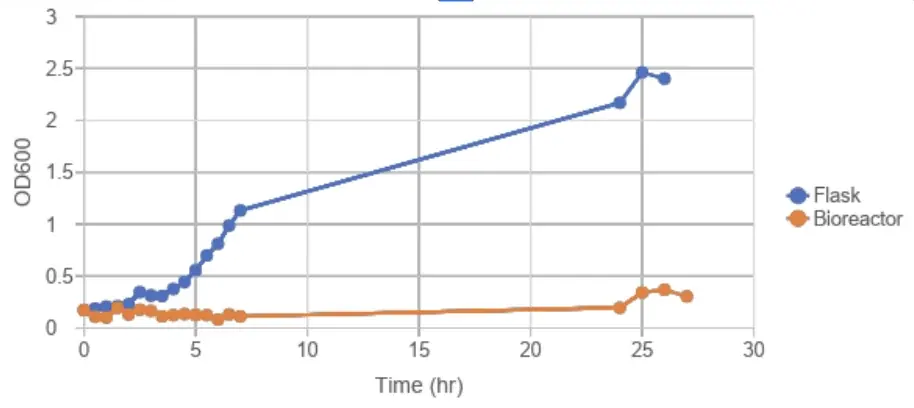
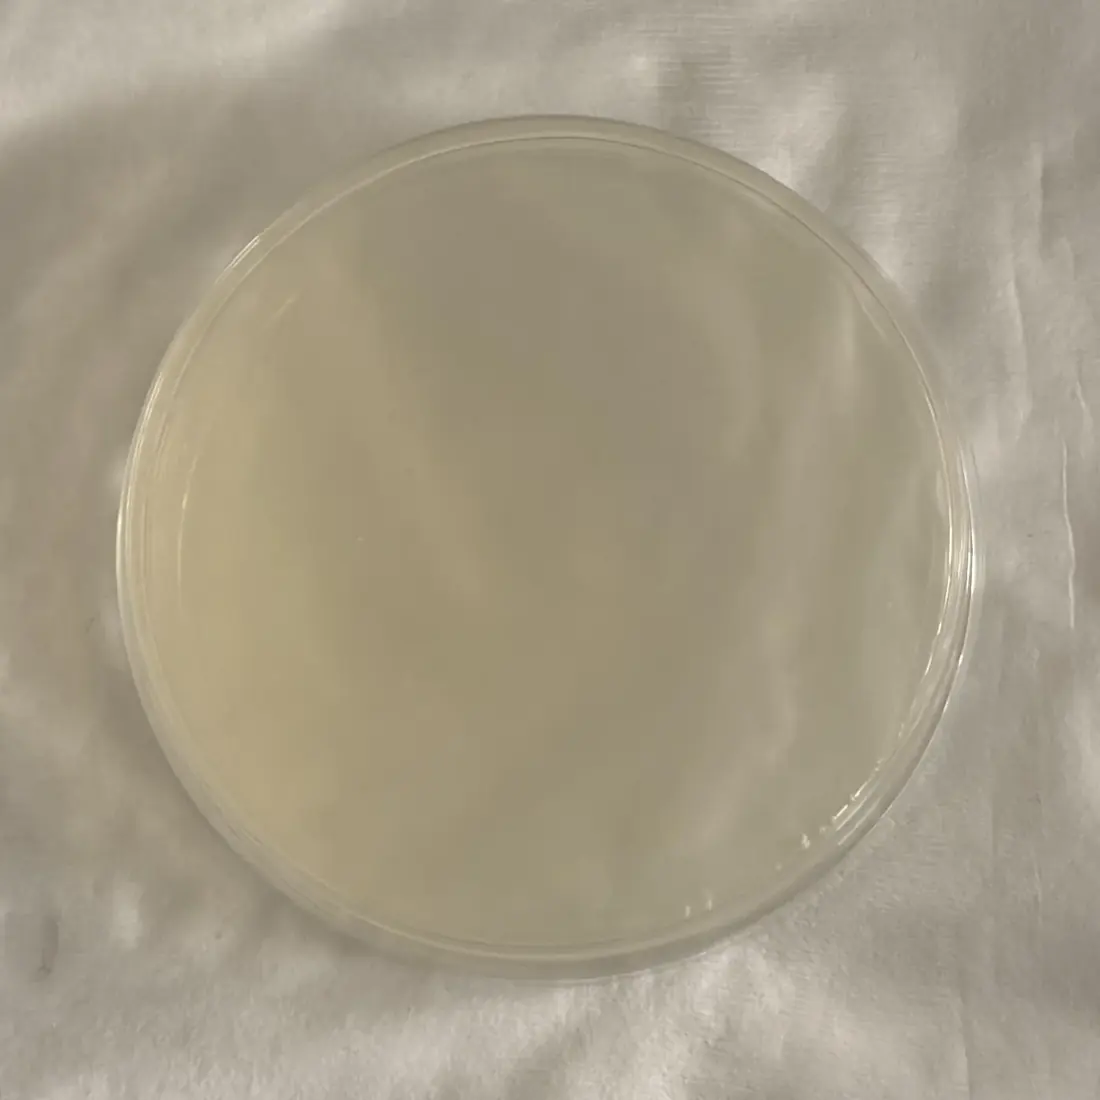
The peristaltic pump reached the target flow rate of 94 mL/min, but the first trial was terminated early by localized medium leakage within the pump. Final OD600 readings were 0.304 (in‑tube) and 0.48 (medium reservoir) (the growth chart below). To confirm microbial presence and viability, 2 mL of medium was drawn from the shell side of the hollow‑fiber membrane and plated on LB agar. We observed no colony formation (the plate below), providing functional proof that our bioreactor is biosafe for public agricultural use.
With the new pump, the test ran for 27 hours before its tubing also failed under the load of driving flow through the hollow‑fiber membrane. Over that run, the bioreactor culture changed little relative to the stationary flask, which shows that the low bioreactor readings came from the setup, not from a faulty pump.
Learn
The divergent tube and reservoir OD600 values indicated poor microbial viability; we hypothesize that without active mixing, nutrient stratification and cell sedimentation in the reservoir limited growth. Three changes followed: biocompatible tubing (BPT), for durability and stable sealing at the pump’s transition points; a magnetic stirrer, based on the laboratory hot‑plate stirrer, against sedimentation; and sampling ports moved to the reservoir outlet, for accuracy and lower contamination risk.
DBTL 2 of 2
2.2 DBTL 2 – B. subtilis 168 Growth through the Hollow‑Fiber Membrane, 37 °C
Prototype II‑0614 · 14 June 2026
Design
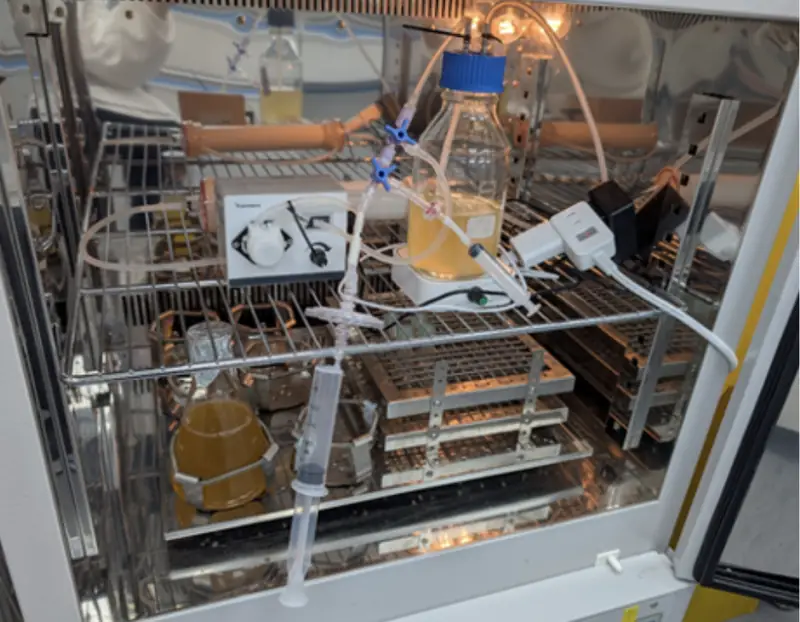
A 200 rpm magnetic stirrer under the reservoir prevents sedimentation and keeps the nutrients homogeneous. The sampler sits next to the reservoir, which holds more of the volume than the membrane, so its samples give a more averaged OD600 of the whole bioreactor module (the illustration below).

Build
A stir bar in the reservoir flask, on a magnetic stir plate, made the sampling region and the reservoir’s inlets and outlets homogeneous, which gave more consistent readings and isolated the effect of the membrane. The whole loop was placed in an incubator at 37 °C.
Test
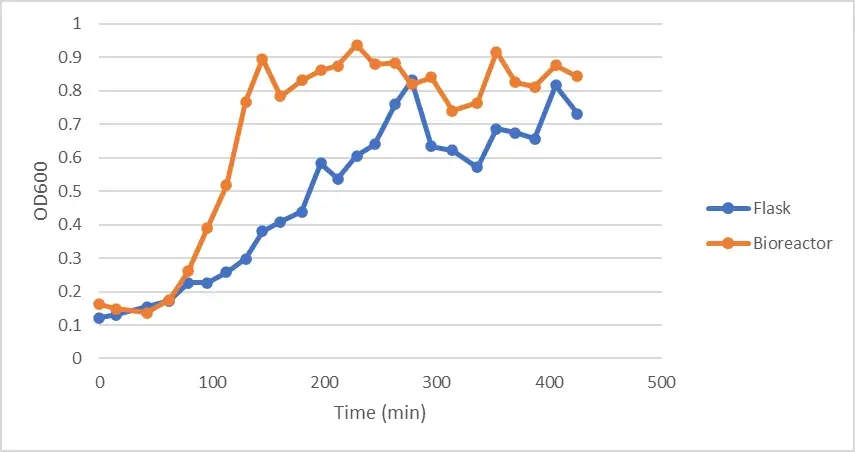
The pump held 94 mL/min throughout, with the bioreactor (experiment) and the flask (control) both at 37 °C. The bioreactor reached the plateau phase (OD600 ~0.8–0.9) after 2 hours, the flask (OD600 ~0.6–0.8) after 4.5 hours (the chart below).
Learn
The growth curve confirmed that continuous stirring is necessary to prevent sedimentation and maintain system efficiency. The next cycle evaluates growth at 22 °C, and higher‑durability BPT tubing remained necessary against the tube degradation of earlier trials. On the strength of this run, the hollow‑fiber loop was integrated with our photometer (3.5).
Engineering the Pro Photometer
DBTL cycle 1 of 5
3.1 DBTL Cycle 1 – Pro In‑Line Photometer Light Path
Before anything was printed
Design
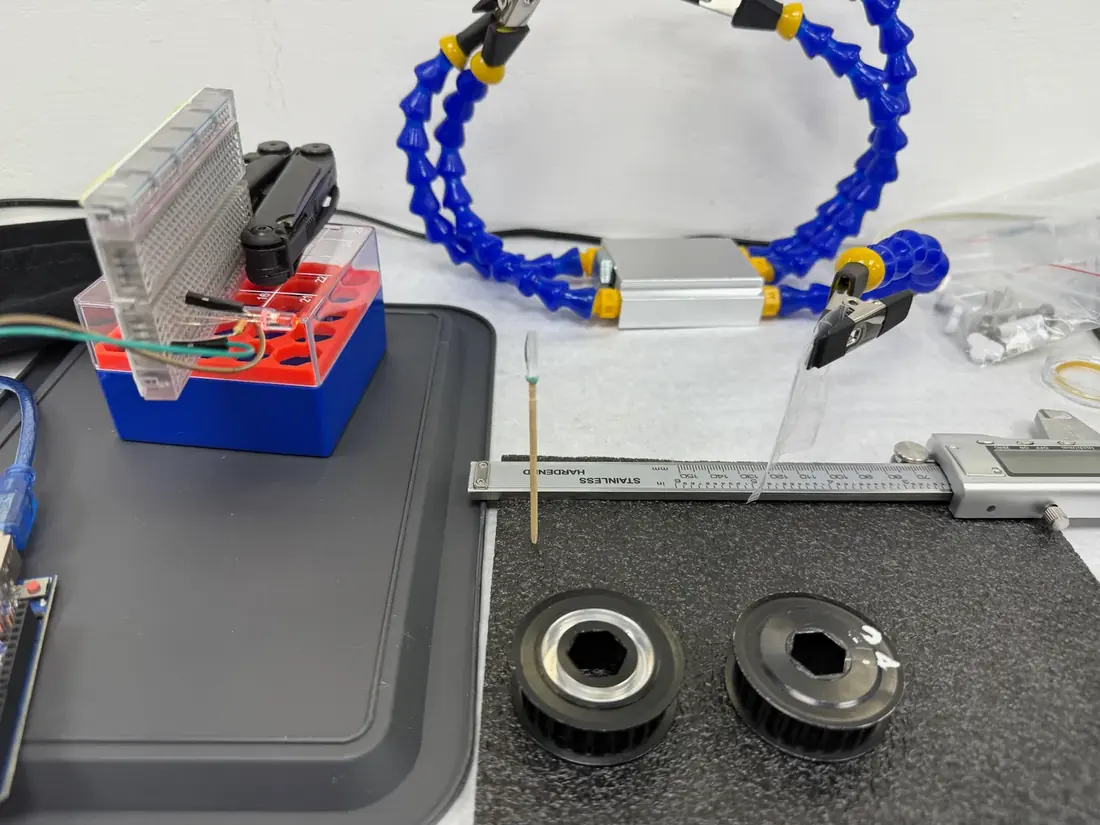
Before printing, magnetic soldering clamps held the 600 nm LED in line with a purchased paralleling lens on the bench. A 2 mm slit passed part of the parallel beam through a beam splitter to two lux sensors.
Build
All components except the lens were fixed, leaving the lens position as the single variable.
Test
The lens was moved along the axis, with small adjustments to the slit and sensors, until the beam steadily illuminated both sensors. The distances were measured and drawn up for the dry‑lab hardware team’s 3D CAD model.
Learn
The measured spacings (below) became the fixed geometry for every later build.
LED tip to lens
5.5 cm
Lens to beam‑splitter center
10 cm
Beam‑splitter center to each sensor
2 cm
DBTL cycle 2 of 5
3.2 DBTL Cycle 2 – Pro In‑Line Photometer V1
Horizontal, on a printed rail
Design
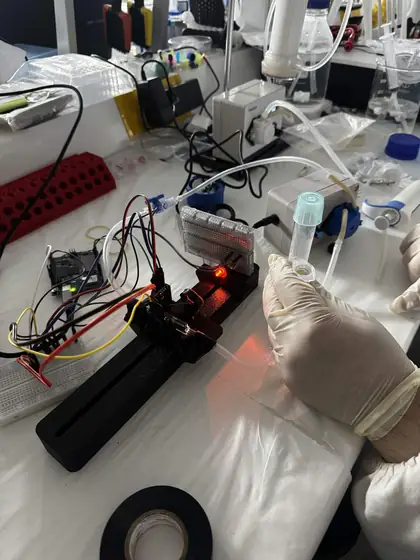
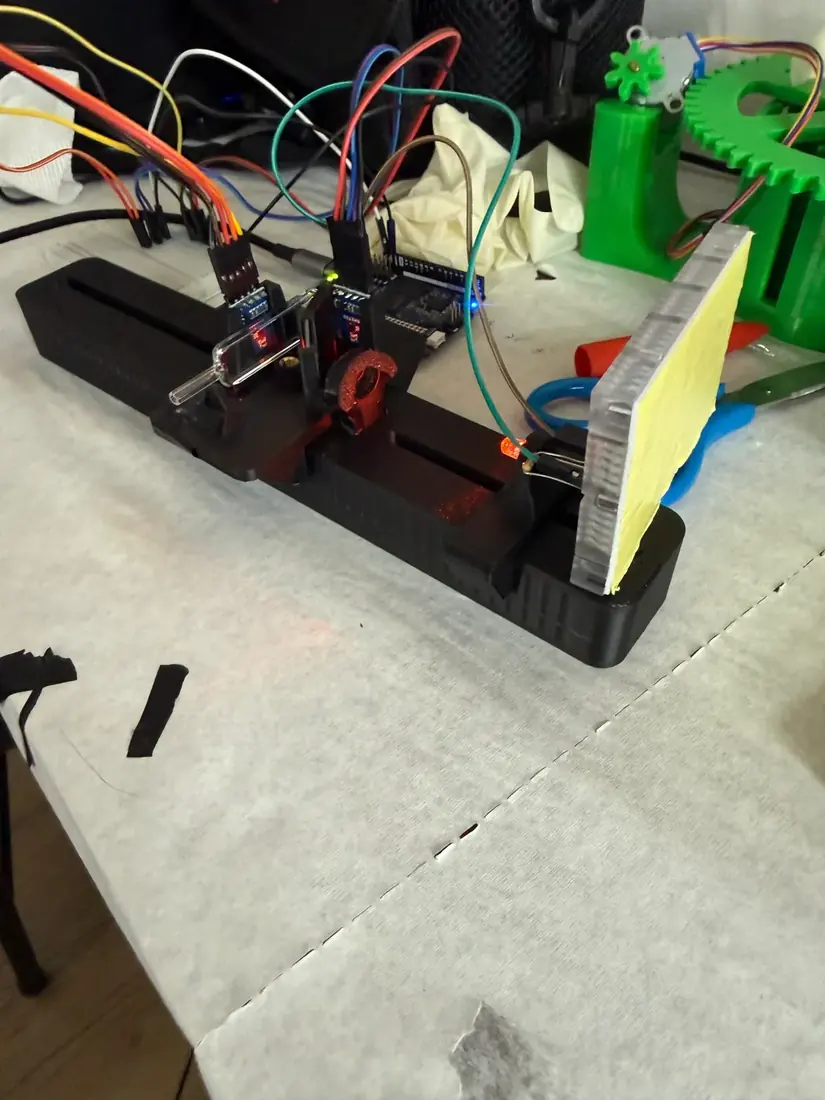
V1 places the bench layout in the loop. The light path stays horizontal, as on the bench, and each component stays adjustable, since the cycle 1 spacings were not yet trusted as final. The in‑line flow cuvette reads the culture with nothing drawn out.
Build
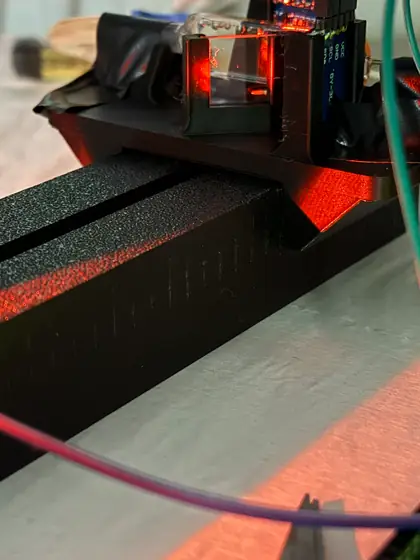
The optical train slides on a single printed rail, set by hand to the cycle 1 distances. The flow cuvette is plumbed into the loop at both ends.
Test
The readings fluctuated drastically, because of bubbling in the flow cuvette and the loose tolerances of the lens and beam‑splitter mounts.
Learn
Both causes were structural, not electronic. In a horizontal path a bubble stays in the beam until flow pushes it out, corrupting a long stretch of readings, and the loose mounts let the lens and beam splitter drift from the cycle 1 geometry between runs. V2 therefore stands the light path up and tightens the tolerances.
DBTL cycle 3 of 5
3.3 DBTL Cycle 3 – Pro In‑Line Photometer V2
The light path stood up
Design
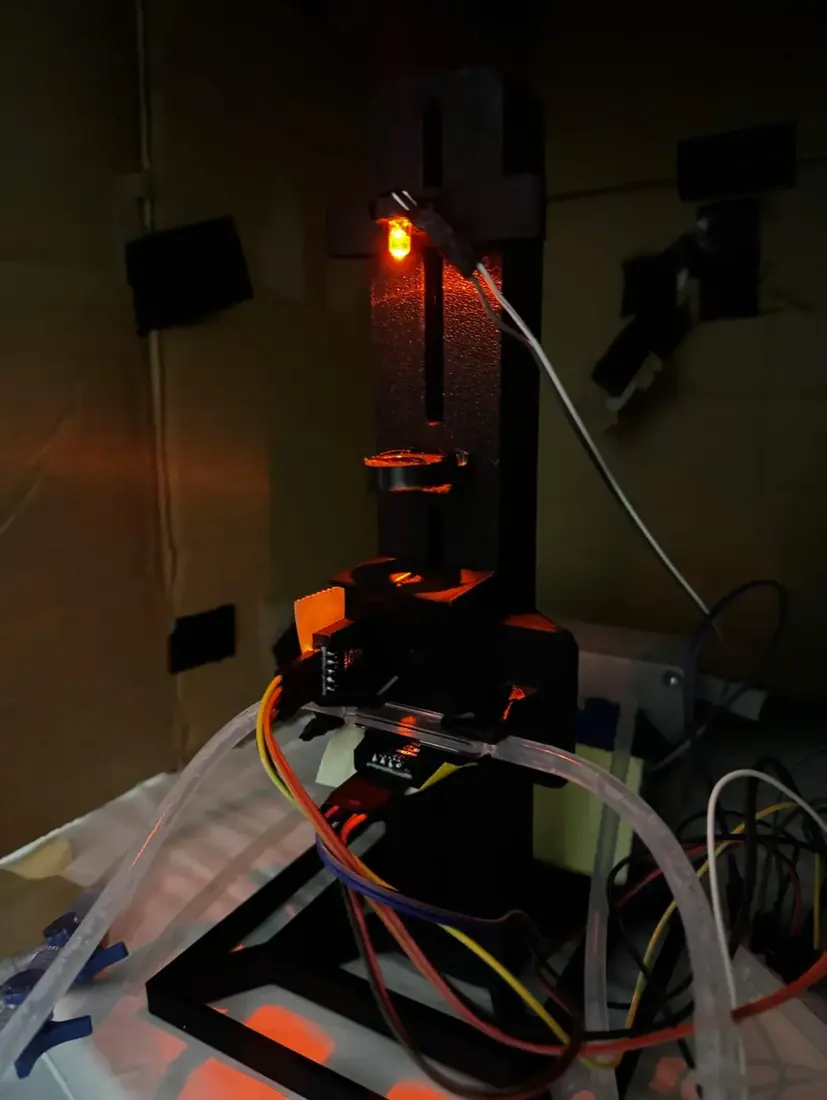
In V2 the LED fires upward through the flow cuvette, so bubbles rise out of the beam by buoyancy. Most of the adjustability was traded for tighter seats that hold the cycle 1 spacings.
Build
A wide square base plate with a rail adapter holds the assembly rigid, with the optical axis vertical.
Test
Two samples were compared against the BioDrop, with the instrument zeroed on growth medium (which therefore reads 0): the medium, and 2 mL of titanium dioxide (TiO2) suspension, a stable scattering target (5.1).
| Sample | Sample sensor (lx) | Reference sensor (lx) | OD, as logged |
|---|---|---|---|
| Growth medium (blank) | 660 | 92.5 | 0 |
| 2 mL TiO2 suspension | 495 | 92.5 | 62.5 |
The firmware of the time divided the absorbance, 0.125, by the cuvette path in meters (0.002 m) and logged 62.5. On the standard 1 cm path the firmware now uses (7.2), the same reading is 0.62.
The constant reference reading shows that the LED was stable between measurements, so the drop on the sample channel came from the sample.
Learn
The main problem was the calibration procedure, not the optics. Our photometer was blanked on growth medium and the BioDrop on distilled water, so the two reported absorbance against different baselines; the roughly 20% disagreement we had attributed to the optics was largely a procedural artifact. Every later comparison uses the blank protocol that followed (5.4).
DBTL cycle 4 of 5
3.4 DBTL Cycle 4 – Angled Stand
A tilt in a wedge under the body
Design
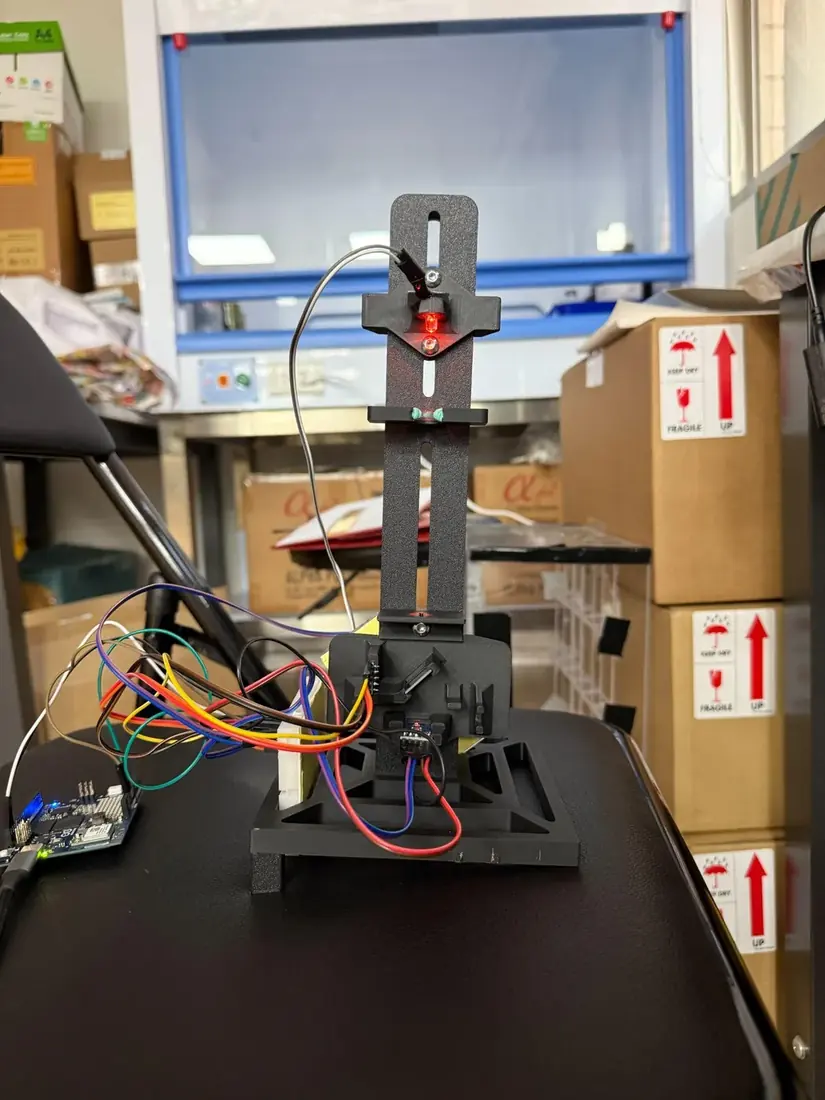
Bubbles still paused in the vertical cell. A tilt leaves no horizontal surface inside the cuvette, so bubbles have a continuous upward path along the wall. The tilt sits in a wedge under the body, which keeps the cycle 1 beam geometry and can be reprinted at another angle without disturbing the alignment. Gas is also removed from the loop before a run.
Build
The printed wedge has structural support underneath, so the body does not flex under its own weight. A dual Luer valve with syringes bleeds gas from the loop before the instrument starts.
Test
The instrument was zeroed on medium, and 1 mL and 2 mL TiO2 suspensions were run through the same cell.
| Sample | Sample sensor (lx) | Reference sensor (lx) | OD (au), as logged |
|---|---|---|---|
| Growth medium (blank) | 137.63 | 17.23 | 0 |
| 1 mL TiO2 suspension | 120.44 | 18.33 | 0.3712 |
| 2 mL TiO2 suspension | 111.62 | 18.33 | 0.5785 |
The OD column is what the firmware of the time logged; it is not recomputed with the formula in 7.2.
Learn
The instrument separates the two concentrations cleanly and in the right direction, so the tilted geometry holds; doubling the TiO2 moved the reading by a factor of 1.56, which this data alone cannot explain. The reference channel moved 6.4% between blank and samples, although its beam is split off before the sample. Either the source drifted or the reference path picks up stray light; ambient light is a candidate, since the path is open to the room and neither sensor is shielded. An untrusted reference cannot correct readings.
TiO2 shows that the optics work, but as a static sample it does not move, grow or produce bubbles. V4 therefore requires an enclosed light path from the LED to both sensors, direct LED control in case the source drifts, live display of both channels, and a long run on flowing culture.
DBTL cycle 5 of 5
3.5 DBTL Cycle 5 – Pro In‑Line Photometer V4 and the 22 °C B. subtilis 168 Growth Curve
More than 400 hours in line
Design
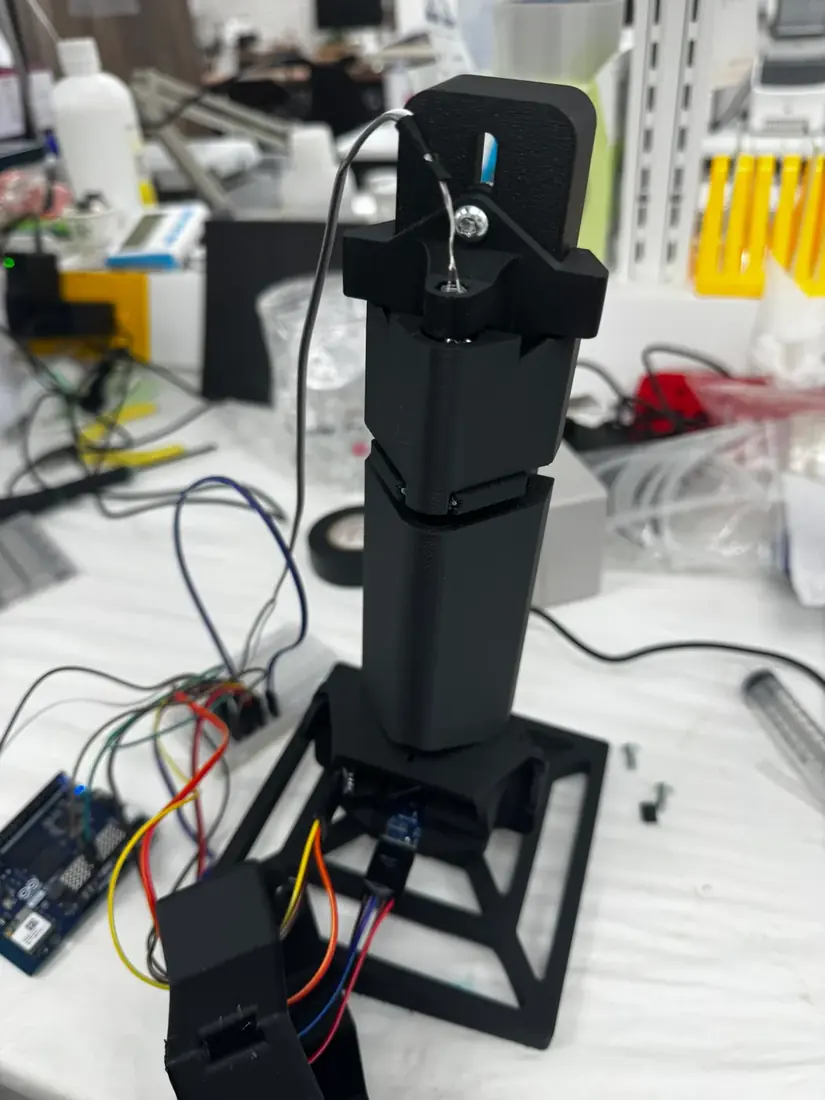
V4, the prototype of the long run, makes three changes:
- Component positions are fixed at their default alignment, which removes the drift seen in V1.
- TPU lines every mount surface touching glass, gripping the cuvette and lens without scratching them; scattering from a scratched 2 mm cuvette window reaches the same detector as scattering from cells.
- Snap‑in covers run the full length of the light path from the LED to the sample sensor, so no room light reaches either detector.
Build
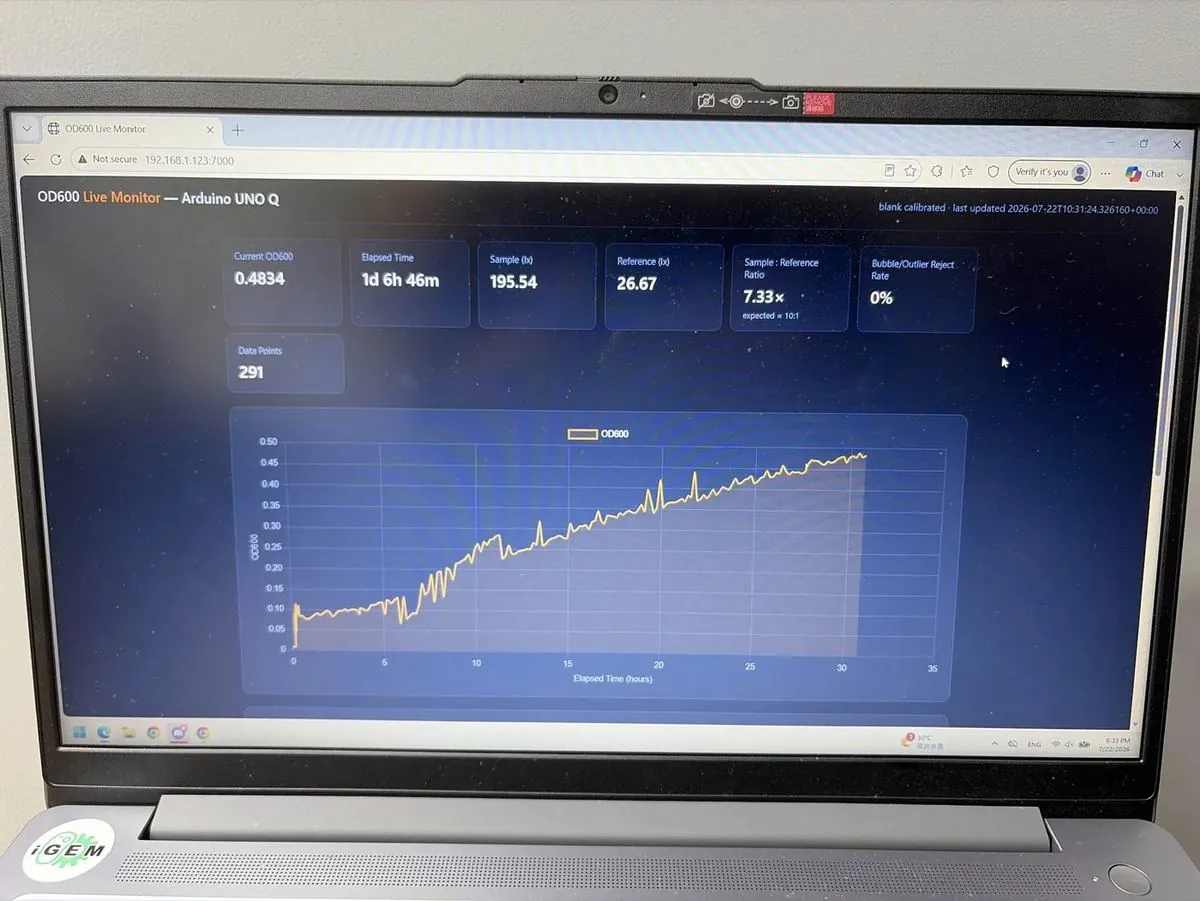
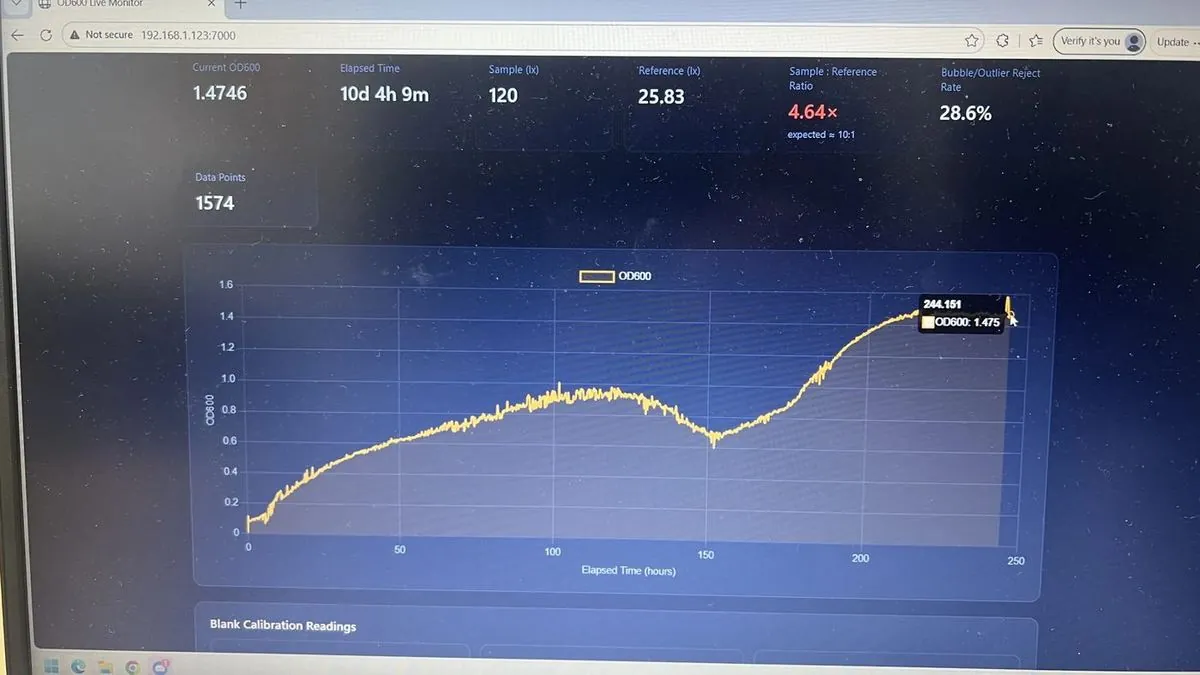
The instrument runs on an Arduino Uno Q. A live web dashboard on the local network shows OD600, elapsed time, both lux readings, their ratio, the bubble and outlier rejection rate and the data‑point count, so the run can be watched from any machine without touching the rig.
Test
Engineered B. subtilis 168 at 22 °C was passed from the bioreactor loop through the flow cell in line, with no sampling event and no material removed. The run passed 400 hours.
| Elapsed | Points | OD600 | Sample (lx) | Reference (lx) | Ratio | Rejected |
|---|---|---|---|---|---|---|
| 3 d 7 h 57 m | 586 | 0.7661 | 171.67 | 26.67 | 6.44× | 42.9% |
| 6 d 20 h 58 m | 1,097 | 0.7683 | 171.49 | 26.67 | 6.43× | 14.3% |
| 7 d 21 h 28 m | 1,244 | 1.1804 | 141.85 | 26.67 | 5.32× | 0% |
Data: the run’s readings (Google Drive)
Late in the run the trace dropped sharply. We first suspected contamination, but the recirculation pump had failed; a teammate confirmed this on inspection and replaced the pump the same evening (notebook, week 22).
Learn
The run covers lag through decline in one unbroken series, which manual sampling cannot produce, and showed the instrument’s limits:
- Noise is tight below about OD600 0.4 and ragged above about 0.8, so precision is not uniform across the range.
- The rejection rate moved from 42.9% to 14.3% to 0% within one run. These cannot all be cumulative, and the record does not state the rejection rule or its computation window.
- The dashboard expects a sample‑to‑reference ratio near 10:1 and we measured 5.3× to 6.4×, so either the split ratio or the expectation is wrong.
Simplified Photometer (Slim)
4.1 Rationale
The beam splitter, the paralleling lens and the flow cuvette account for US$275 of the Pro photometer’s US$360.60 in parts (10.1). The flow cuvette is required for in‑line measurement, so the Slim removes only the paralleling lens and the beam splitter.
4.2 Design Changes
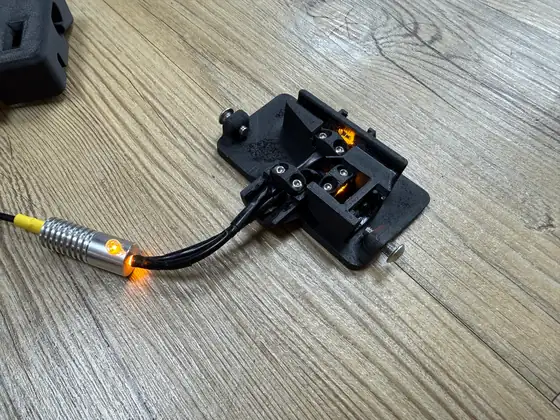
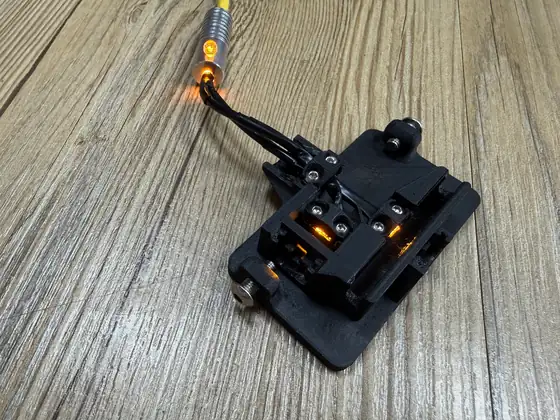
Optical fibers carry the light in parallel paths of controllable, proportional intensity, which replaces both the paralleling lens and the beam splitter. For ease of design, the fibers are split 1:1 between the sample and reference sensors, instead of the Pro’s 9:1. These changes reduced the size of the photometer by more than two‑thirds and its cost by more than US$130.
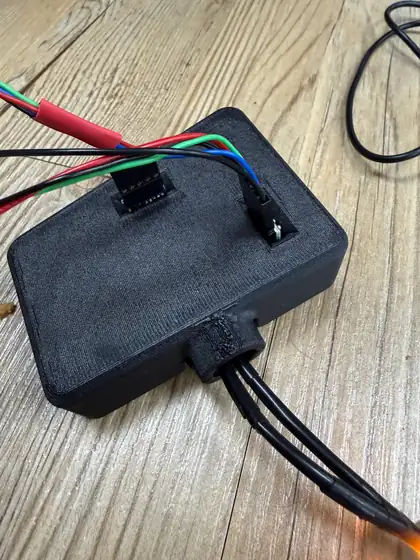
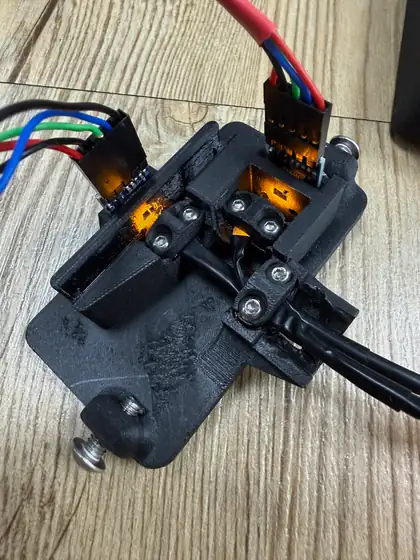
4.3 Comparison with Pro
The Pro reads OD600 nearly 1:1 with the BioDrop, so the bounds of its range also roughly match the BioDrop’s. The Slim matches in linearity but reads values about 5 times smaller, a sensitivity ⅕ that of the other two instruments; its estimated gain in range is untested (5.3). The Slim is cheaper to build and has fewer components, so it needs less maintenance to stay accurate over long periods. Part 5 addresses the ⅕ difference.
4.4 CAD Files & Material List
The Slim photometer has no full assembly guide yet. Its materials list (10.1) and CAD STL files (10.2) are in Reproduction.
Calibration
5.1 Rationale
Calibrating with culture brings problems of growth time, settling and cell lysis, so we used stable scattering targets. The iGEM standard for OD600 calibration uses SiO2; TiO2 was available in our lab, performs nearly identically when suspended in 1% SDS solution, and is cheaper, so we ran a TiO2 calibration curve first and an SiO2 curve second. The Slim photometer was finished after the TiO2 test and was tested only in the SiO2 run. The mass of particles added is the ground‑truth linear axis against which the BioDrop, the Pro and the Slim are each judged independently.
5.2 TiO₂ Calibration of the Pro Photometer
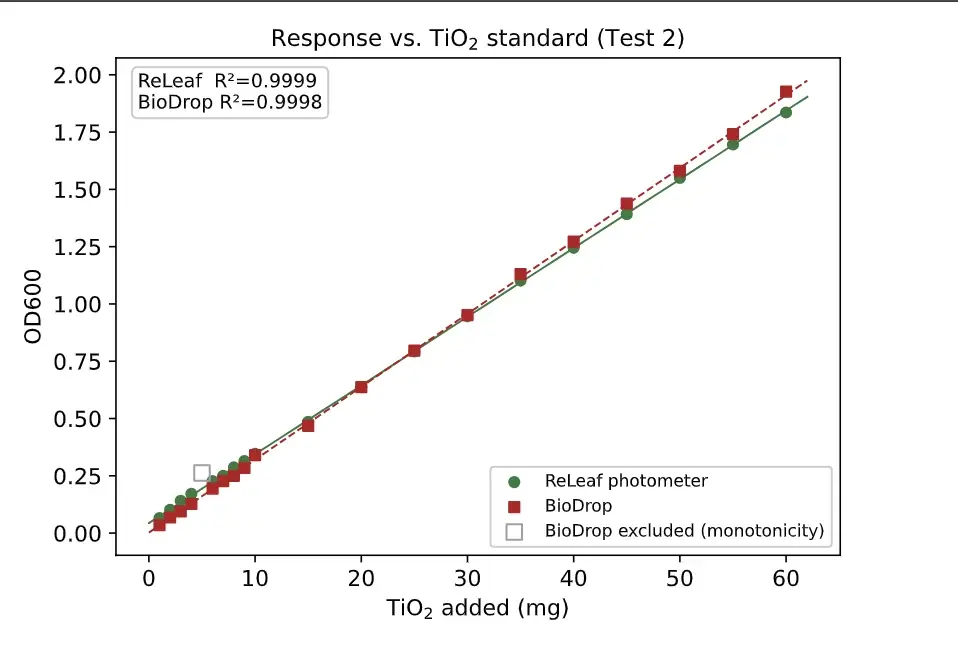
Known amounts of TiO2 were added to a 500 mL solution, with a BioDrop cuvette spectrophotometer as the reference instrument: 1 mg at a time up to 10 mg, then in 5 mg increments up to 60 mg. The small first steps give a denser low‑density region, in case the in‑line photometer proved inaccurate at low values; the uniform wider spacing gives a direct agreement comparison while still testing linearity.
One single‑point exclusion was applied on objective grounds (open marker): the 5 mg BioDrop reading exceeds the readings both above and below it, which is impossible for an increasing standard. Against the TiO2 mass added, each instrument regresses at R² > 0.999 (Pro photometer 0.9999, BioDrop 0.9998), so the raw, uncalibrated output is as linear in true concentration as the reference instrument.
A line fit through the raw Test 2 points has a residual scatter of RMSE = 0.011 OD600 (R² = 0.9997), which quantifies the tightness of the raw agreement.
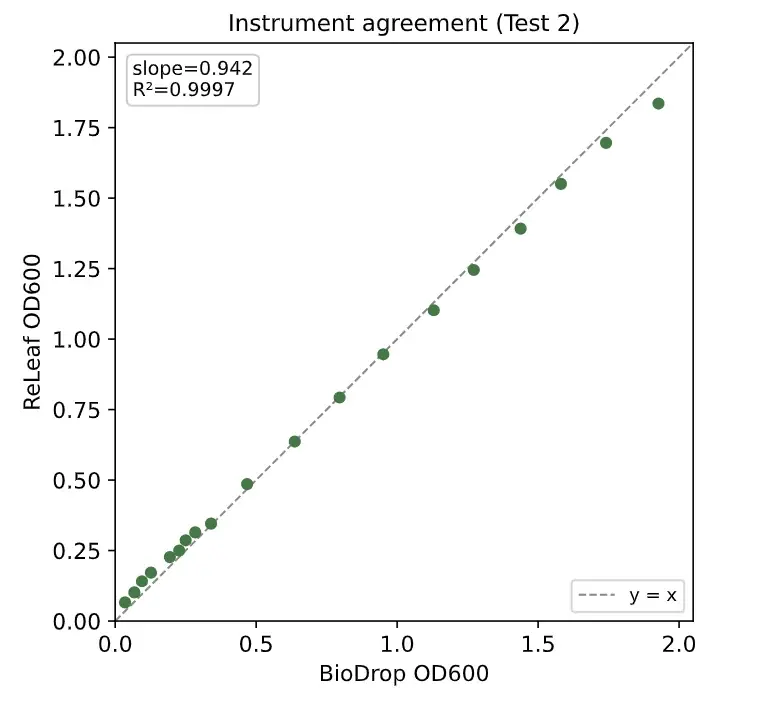
We had expected to need a calibration transform fitted against the BioDrop, but the raw output already sits near one‑to‑one with the reference (median paired difference under 4%). On the evidence of these two runs we treat calibration as unnecessary, not pending, and every reading in this wiki, including the continuous growth curve, is the raw, uncalibrated output; the SiO2 run was still to confirm this.
The two TiO2 runs in fullthe loop, Test 1, its exclusion
Test 1 added TiO2 1 mg at a time for 40 data points, a dense, uniform series that resolves how linear each instrument is; Test 2 is the series above. The loop consisted of a magnetic stirrer, a peristaltic pump, the photometer and a 500 mL reservoir, whose cap had holes for the loop inlet and outlet, a sampling port, and an air hole that prevented a vacuum during sampling or pressurization when adding TiO2.
In Test 1 the 37 mg BioDrop reading is a handling error, off the trend of its neighbors, shown as an open marker. Its paired photometer reading is on trend, which puts the error in the reference measurement.
Against TiO2 mass, the raw output has a residual scatter comparable to the BioDrop’s (Test 1, 2–40 mg: 0.030 against 0.031 OD600).
5.3 SiO₂ Calibration of the Pro and Slim Photometers
The Pro and Slim photometers ran in sequence on one SiO2 series. Before each addition, a set amount of the solution was sampled for the BioDrop, keeping the total volume constant.
Both photometers responded consistently as SiO2 increased. The BioDrop readings are irregular past OD600 2, because from there each sample was diluted 4‑fold and the reading multiplied by 4, which amplifies any small discrepancy; past that point the BioDrop data are almost entirely unreliable.
The Slim was more linear (R² = 0.992) than the Pro (R² = 0.974), which demonstrates the Slim’s reliability and supports the Pro’s TiO2 result. The likely cause is the Slim’s structure, which places the light closer to the sensors and cuvette. At that distance, light scattered through small angles by the 1 µm SiO2 particles still reaches the 3.5 mm × 2 mm sensor receptor. More light therefore reaches the Slim’s sample sensor and its measured OD600 is lower: it no longer matches the BioDrop, but the measurable range increases.
To compare sensitivity within the BioDrop’s specifications, the range was narrowed to OD600 1.
In this range the R² values were 0.9956 (BioDrop), 0.9874 (Pro) and 0.9947 (Slim): within the range where the BioDrop is reliable, all three instruments follow SiO2 concentration in the same proportional way. The Pro’s line runs parallel to the BioDrop’s. Plotted against each other, the two give a slope of 1.001 and a constant offset of about 0.12 OD (intercept −0.123), the Pro reading lower at every point.
The Slim’s readings fall on a straight line against the Pro’s (R² = 0.993) at about ⅕ of the scale: each increase in SiO2 moves its reading about ⅕ as much. Because its reading climbs more slowly, the Slim should read denser solutions before its sensor runs out of range. We estimate about five times the range of the BioDrop, but have not tested past the top of this series.
5.4 Blank Protocol
The BioDrop is normally calibrated against distilled water, and this difference in blanks caused much of the inaccuracy of our early prototypes (3.3). Both instruments are now blanked on the growth medium, which accounts for the medium’s own absorption of 600 nm light. This change gave almost entirely accurate data that aligned strongly with the BioDrop readings.
5.5 Calibration Procedure
Neither photometer needs a calibration equation fitted to the BioDrop, since both gave nearly equally linear data in the TiO2 and SiO2 tests. The Pro reads OD600 directly; the Slim’s readings need one scale factor (×5.57, 5.3).
Final Designs & Specifications
The Pro photometer prioritizes long‑term stability and continuous monitoring; the Slim photometer prioritizes lower cost, smaller size and easier reproduction.
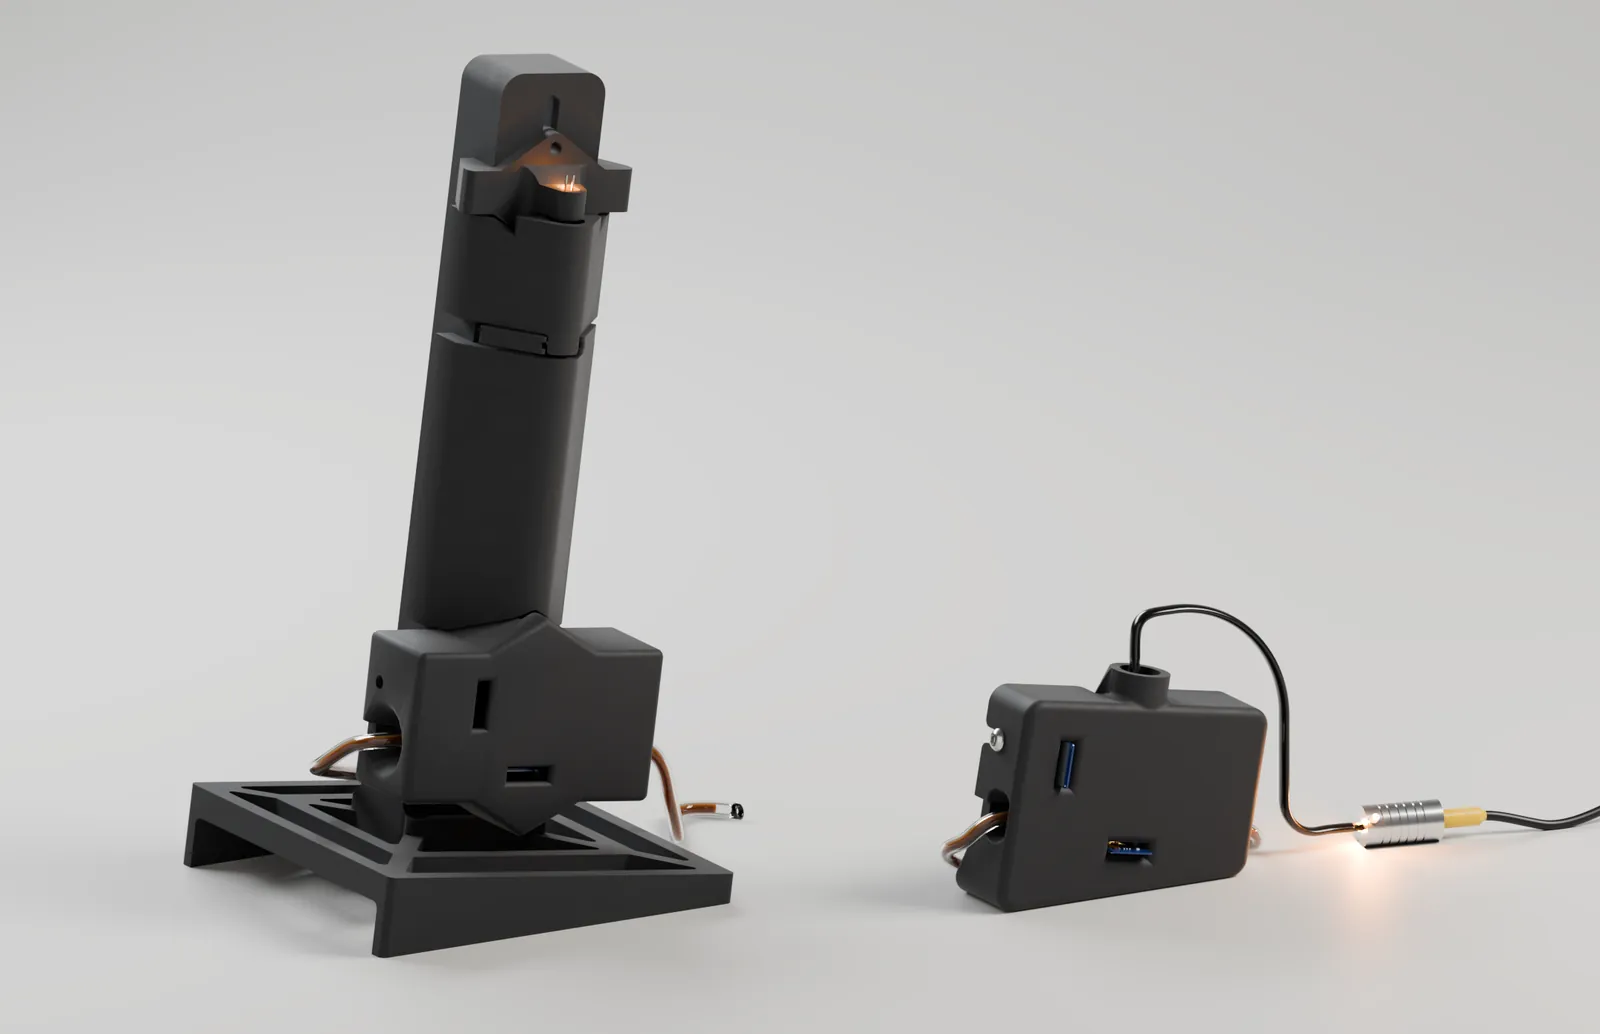 263 mm
127 mm
129 mm
72 mm
34 mm
99 mm
Pro photometer263 mm tall, footprint 129 × 127 mmSlim photometer72 mm tall, footprint 99 × 34 mm
6.1 Which One to Use
| Property | Pro | Slim |
|---|---|---|
| Best for | Long bioreactor runs | Low cost and small size: teaching, replicate vessels, a second instrument |
| How the light is split | Paralleling lens and a 90:10 beam splitter | Two optical fibers, 1:1 |
| Reference channel | 10% of the beam, to its own sensor | One fiber of the two, through an identical window |
| Printed parts | 8 | 5 |
| Reads OD600 | Directly, up to OD 2.5 | With a ×5.57 scale factor |
| Finest step (SiO2) | 0.21 mg | 0.49 mg |
| Linearity | Accurate at low OD; reads low above ~2.5 | Linear across the full range (R² 0.992) |
| Longest run | More than 400 hours | Not yet run long‑term |
| Cost | About US$360 in parts (10.1) | Lower: no US$100 lens or US$40 beam splitter |
- Use the Pro for a bioreactor run.
- Its reference beam normalizes every reading against the LED’s own output, so a slow drift in the light is not recorded as growth over hundreds of hours.
- Use the Slim where cost and size decide.
- It is smaller, has fewer parts to build and stays linear at high density; its scale factor must be applied.
Finest step: the smallest change in silica each photometer resolves on the 10 October series, i.e. its point‑to‑point noise divided by its reading’s change per milligram.
6.2 Pro Photometer
The Pro is the photometer in the bioreactor loop today.
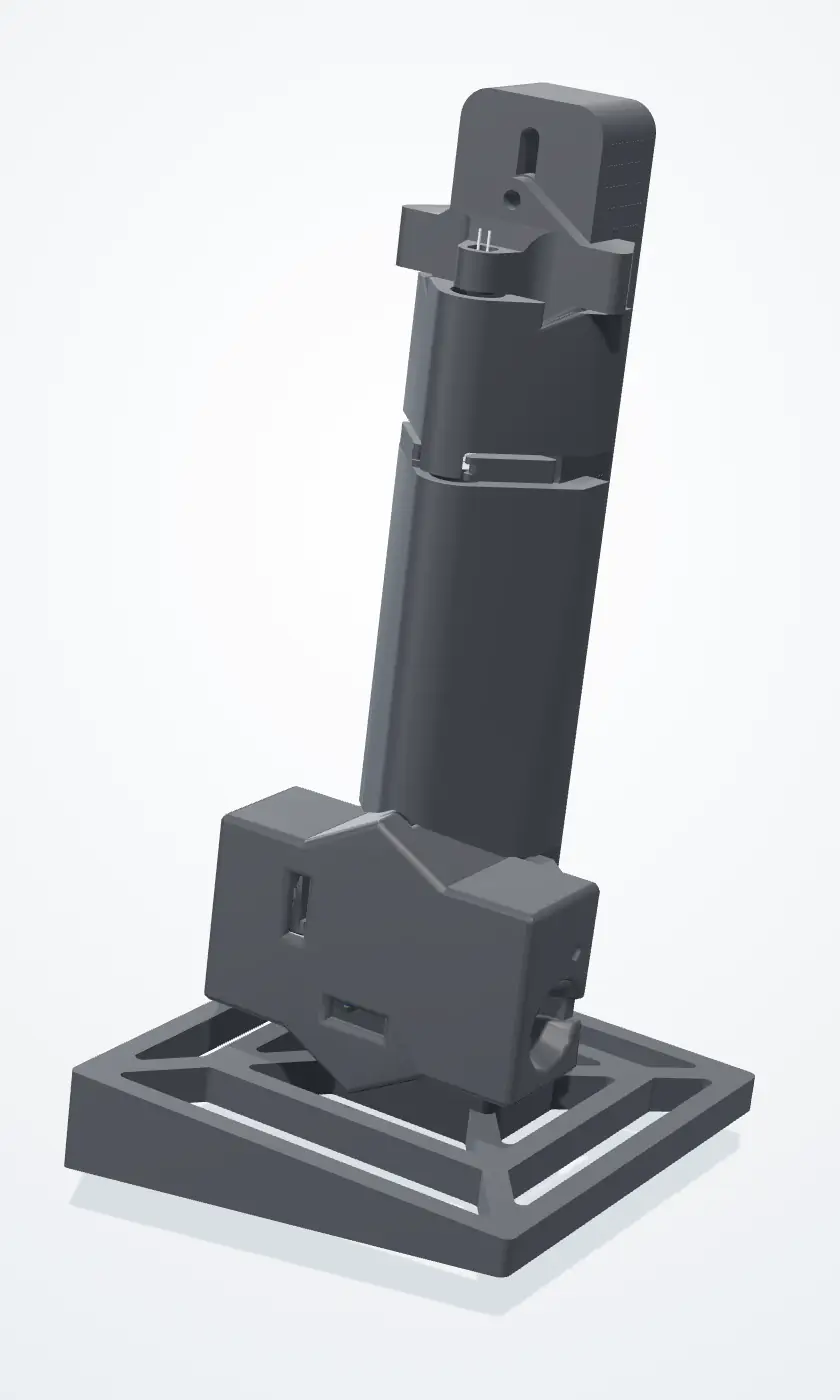
6.2.1 Specifications
- Wavelength
- 600 nm (amber LED)
- Light path
- LED → paralleling lens → 2 mm slit → 90:10 beam splitter → flow cuvette → sample sensor
- Reference
- 10% of the beam, split off at 90°, to a second sensor
- Sensors
- Two GY‑302 lux sensors on one I²C bus
- Flow cuvette
- 2 mm path; readings scaled ×5 to the standard 10 mm
- Controller
- Arduino Uno Q; runs with no computer attached
- Output
- OD600 from the sample‑to‑reference ratio, about every 10 minutes
- Mounting
- Tilted 10° on its base
- Body
- PLA, with TPU‑lined slots for the optics and sensors; snap‑on covers
How a reading is filteredbursts, the median, two gates
The burst filter, the two bubble gates and their test on silica are described in 7.1.
The 14 partsnumbered as in the model
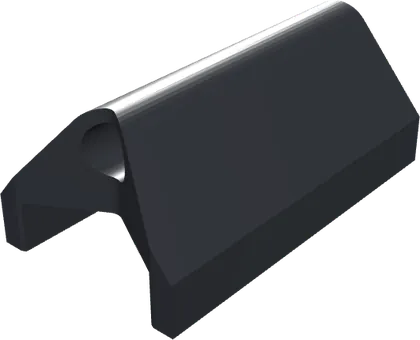
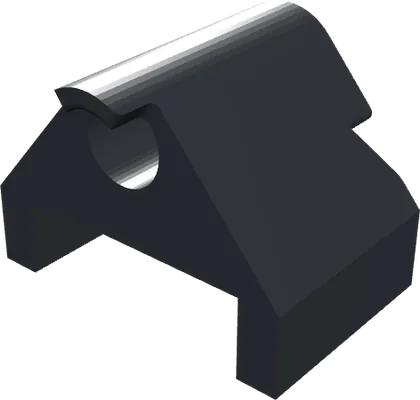
Printed parts 1–8
- 1LED mountHolds the 600 nm LED.
- 2Lens holderHolds the paralleling lens, for a parallel beam.
- 3BodyThe column every part attaches to; sets the light-travel distance.
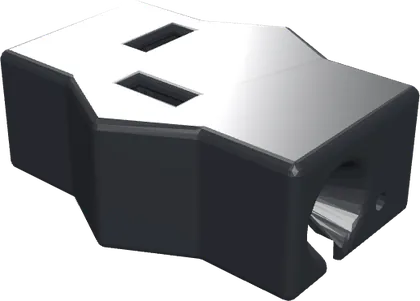
- 4Sensor frameHolds the beam splitter and both sensors.
- 5BaseAngles the column 10° so bubbles clear.
- 6Body coverBlocks outside light along the light path.
- 7Body cover, smallBlocks outside light along the light path.
- 8Sensor frame coverBlocks outside light from the sensors.
Bought-in parts 9–14
- 9600 nm LEDThe light source.
- 10Paralleling lensMakes the beam parallel.
- 11Beam splitter, 90:10Sends 90% on through the cuvette and 10% to the reference.
- 12Flow cuvetteCarries the culture across the beam (2 mm path).
- 13Sample sensor (GY-302)Reads the light after the culture.
- 14Reference sensor (GY-302)Reads the light straight from the LED.
6.2.2 Optical Layout
- LED housing 38 mm
- Light-travel region 117 mm
- Sensor region 62 mm
Light from the 600 nm LED is made parallel by the lens, narrowed by a 2 mm slit and split 90:10. The sample sensor receives the light after the culture, the reference sensor the LED alone. As the LED ages and dims, both sensors register the change, so OD600 is taken from their ratio and the drift cancels.
Choice of 600 nmthree reasons
- Standard. Bacterial density is reported as OD600, so the readings compare directly with the BioDrop and with published growth curves.
- Scattering by cells. At 600 nm a culture dims the beam mainly by scattering off the cells; proteins and DNA absorb in the UV, and most of the medium’s color in the blue.
- Optogenetic switch. CcaS/CcaR responds to green (~535 nm) and red (~672 nm). Amber lies between the two peaks, so the photometer’s light does not switch production on or off.
6.2.3 Mechanical Design
| Requirement | How the final design meets it |
|---|---|
| No bubbles in the reading | The column is tilted 10°: bubbles clear the cuvette in about a quarter of a second. Lying flat or standing upright, bubbles were trapped. |
| No stray light | The light path and both sensors sit in a closed dark chamber. |
| Tight, repeatable fit | PLA body with TPU‑lined slots: the lining grips the lens, splitter and sensors firmly without cracking them, and the readings are steadier over long runs. |
| Accurate prints | Base and body are printed apart and join at a diagonal insert, so neither needs heavy supports. |
| Easy to service | The covers snap onto a groove along the body and lift off to realign the light path or replace a sensor. |
6.3 Slim Photometer
The Slim carries the light in two optical fibers instead of through a lens and a beam splitter, which removes the long light‑travel column.
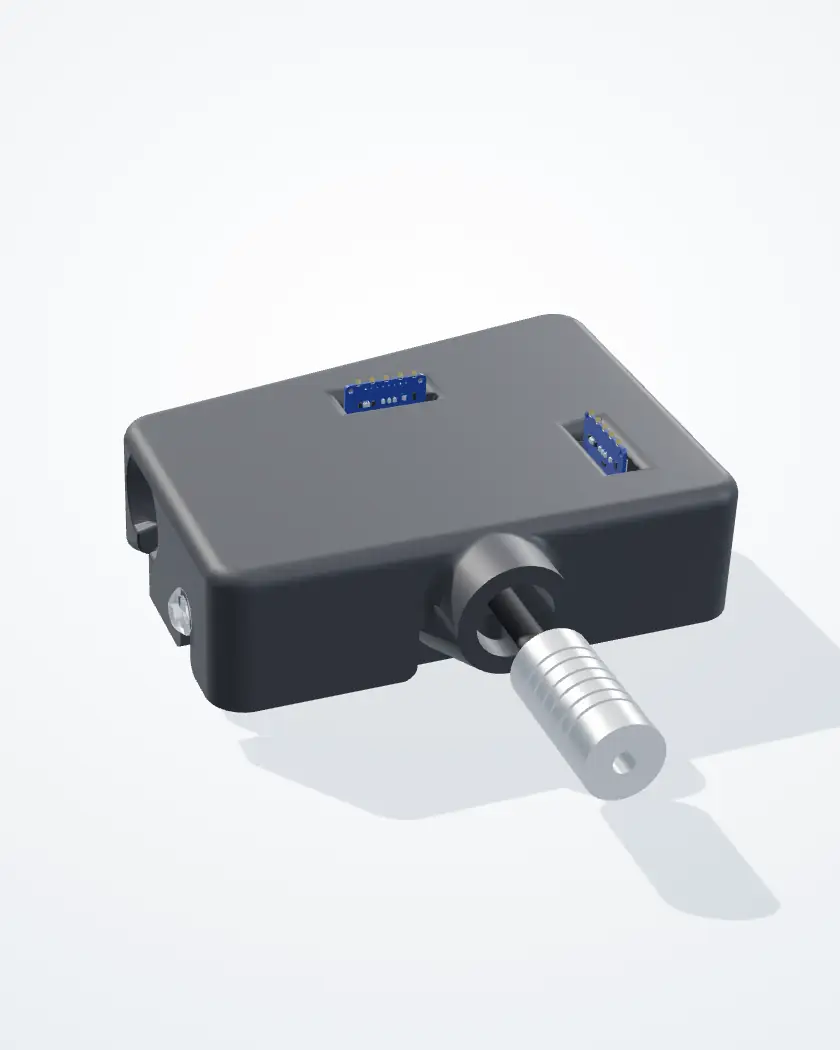
6.3.1 Specifications
- Wavelength
- 600 nm (the same amber LED as the Pro), in a fiber illuminator
- Light path
- LED → two optical fibers, split 1:1 → sample fiber → flow cuvette → sample sensor
- Reference
- The second fiber → an empty chamber of the same shape → reference sensor
- Sensors
- Two GY‑302 lux sensors
- Flow cuvette
- The same flow cell as the Pro
- Size
- 72 mm tall; footprint 99 × 34 mm
- Printed parts
- 5: body, case and three fiber clips
- Linearity
- R² 0.992 against SiO2, full range (5.3)
- Scale
- ×5.57 to read OD600 (5.3)
- Mounting
- The case’s 10° wedge is its foot
The 11 partsnumbered as in the model
Printed parts 1–5
- 1BodyBase plate and optical bench: the cuvette channel, sensor slots and windows.
- 2CaseThe lid over the bench; its 10° wedge is the foot.
- 3Front clipClamps both fibers where they come in.
- 4Sample clipHolds the sample fiber’s tip 1 mm from the cuvette.
- 5Reference clipHolds the reference fiber’s tip at the empty chamber.
Bought-in parts 6–11
- 6Fiber illuminatorAluminum housing with the 600 nm LED; feeds both fibers.
- 7Optical fibers ×2Carry the light to the sample and reference paths.
- 8Flow cuvetteCarries the culture across the sample beam.
- 9Sample sensor (GY-302)Reads the light after the culture.
- 10Reference sensor (GY-302)Reads the light from the reference fiber.
- 11Screws6 × M3 × 8 hold the clips; 2 × M4 × 12 hold the case.
6.3.2 Optical Layout
The reference side copies the sample side’s geometry, so the two sensors receive the same LED and differ only by the culture. As in the Pro, the sample‑to‑reference ratio cancels LED drift, with the fiber split in place of the beam splitter.
6.3.3 Mechanical Design
| Requirement | How the final design meets it |
|---|---|
| Fewer parts | Fibers replace the lens, the beam splitter and the 117 mm light‑travel column. |
| Fiber tips held square | Each tip is clamped under a screwed clip, square to its window. |
| Matched paths | The reference chamber is a copy of the sample side, so only the culture differs. |
| No stray light | The case closes over the bench; only the sensor headers come up through it. |
| No bubbles in the reading | The case’s 10° wedge is the foot: the same tilt as the Pro. |
| Easy to service | Two M4 screws hold the case; the clips come off with an Allen key. |
6.4 One Limit for Both
The ×5.57 factor and the OD600 2.5 working limit come from a single run on one scattering standard (silica). Cells are larger and softer than silica and change shape as they grow, so they scatter differently. Both photometers need the same series run on culture before they are used for exact numbers.
Software
7.1 Data Acquisition and Filtering
-
Take a burst of 14 readings
For each measurement the LED switches on and the sensor takes 16 lux readings in a short burst; the first two are discarded while the LED settles. A bubble drifting through the beam during the burst may make one or two readings jump.
-
Find the median
The firmware takes the median of the burst, not the mean: one or two extreme readings drag a mean but barely move the median, a bubble‑resistant estimate of the signal.
-
Measure the spread
The firmware calculates the median absolute deviation (MAD), the typical distance of the readings from the median.
-
Reject outliers
Readings beyond median ± 3·MAD are rejected before OD600 is calculated. The rejection percentage is reported live; above 50% the dashboard shows it in red as an alarm for excessive bubbles in the bioreactor, so a long‑lasting air slug cannot leave the record wrong indefinitely.
Testing the filter on silica (10 October)
On 10 October both photometers ran in series on the same loop for 4.5 hours on 1 µm silica microspheres, across 40 concentrations in 2.5 mg steps (5.3). Each reading was computed with eight estimators from the same 14 readings and compared with the BioDrop. In clean flow the eight never disagreed by more than 0.004 OD, less than the scatter during calibration.
Under bubbles, one‑sided estimators failed. Five of the eight (MAD, Qn, biweight, mean and median) treat unusually bright and dark readings alike; the other three (upper, p75 and p90) keep only the bright end of the burst. The instrument had run “upper”, assuming a bubble can only block light, but in a turbid culture air replaces particle‑laden liquid and more light reaches the detector. The five symmetric estimators stayed within 0.02 OD of each other on the Pro and 0.006 OD on the Slim; the three one‑sided ones moved together away from them, better on the Pro and worse on the Slim, so a bubble pushes differently in the two. We kept the symmetric MAD filter.
No estimator rescues a reading taken through air. A bubble can spoil a few of the 14 readings, or fill the cell for several seconds so that every reading agrees perfectly and is wrong. The MAD filter caught 94% of the first kind and none of the second. In one instance the Pro reported OD600 0.79 for 6 minutes while the actual value was 3.18, and the software flagged every reading as good. We therefore added two gates after the estimator:
Gate 1: the burst against itself
The 14 readings are computed with the MAD filter and with an upper‑percentile estimator; if the two differ by more than 0.03 OD, the reading is rejected. The upper estimator is not used for the OD itself: the two agree within a few thousandths of an OD in clean flow and diverge when a bubble passes. On the 10 October run this flagged 97% of disturbed readings and rejected none of the clean ones.
Gate 2: the reading against the recent past
A reading more than 0.05 OD or 5% from the last accepted value is held back; the new level is accepted once 3 consecutive readings agree with it. This catches air slugs, because a growing culture does not move 0.05 OD in 30 minutes. It costs a few minutes’ delay and some lost points, and keeps the growth curve reliable over days and weeks.
Data: Google Drive
7.2 OD600 Calculation
Each sensor reports illuminance in lux: the sample sensor measures light transmitted through the culture, the reference sensor light diverted before the sample. At the start of a run, a blank on the growth medium gives K, the sample‑to‑reference ratio with no bacteria present:
During the run, each filtered pair of readings is converted to OD600:
S and R are the sample and reference readings in lux. The factor 5 (10 mm ÷ 2 mm) scales the absorbance across the 2 mm cuvette to the standard 1 cm path. The dashboard snapshots of the 400‑hour run (3.5) reproduce this formula to within 0.0003 OD.
Electronics and Firmware
8.1 Control Architecture
Both final photometers use a soldered PCB connected to an Arduino Uno Q, not a breadboard. The Uno Q runs the code from a power source alone, with no computer attached, which brings the bioreactor closer to being cheap and accessible and removes a failure point (a computer–Arduino cable coming unplugged).
The Arduino has a limited number of ground ports, so the ground wires of the sensors, LED and transistor are linked together.
A transistor lets the LED run at a different voltage from the sensors and switch on and off without affecting them. As the bioreactor scales up, the LED voltage may need to increase, and keeping the LED off between readings is safer and more sustainable than leaving it on 24/7.
The LED’s ground wire connects to the transistor’s collector. Arduino port D3 connects to the base through a 1.2 kΩ resistor; the base also passes through a 10 kΩ resistor to the emitter output, and these join the sensor ground wires at one Arduino ground port.
The SDA and SCL lines of the sample and reference sensors are joined and connected to the same Arduino ports, so one microcontroller reads both sensors at the same time.
The LED takes a 5 V supply, which may need to increase when the bioreactor scales up; the sensors need 3.3 V. The two sensor supplies are therefore combined and the LED’s is kept separate.
The PCB leaves six wire outputs (SCL, SDA, D3, 3.3 V, 5 V and ground), which simplifies the last setup step.
Specifications and Future Implications
9.1 Future Use
The photometer lets students and researchers measure OD600 during growth runs without sampling, which removes the chance of human error in that process. Its parts cost about US$360 for the Pro (10.1) and less for the Slim (6.1); the BioDrop it was compared against during calibration costs about US$15,000.
9.2 Limitations
Single‑Wavelength Measurement
The system is designed for 600 nm only, so it cannot replace a spectrophotometer for applications requiring broader wavelength analysis.
Manual LED Alignment
To keep the photometer compact, we did not test multiple LED clip designs, and the LED does not always point straight when first seated. During assembly it is rotated in the clip until the light path aligns with the sensors, a short manual step.
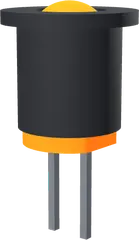
The LED in its clip
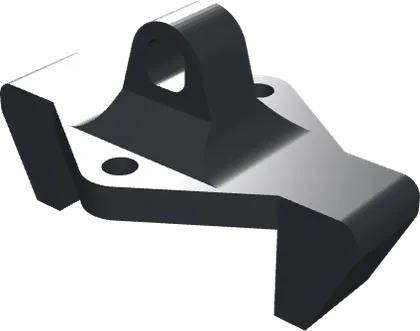
The LED mount (printed part 1, 10.2)
Further Validation of the Slim Photometer
The Slim photometer needs further comparison with the Pro and the BioDrop to determine where its performance matches theirs and where it needs refinement.
Reproduction
10.1 Materials List
The Pro photometer’s bill of materials, with part numbers and unit costs in US dollars, and the Slim photometer’s parts. Pictures in the Pro’s table are the parts’ CAD models.
Bill of materials, Pro photometer17 parts, US$360.60 known
| Part | Model / spec | Unit cost (USD) | Qty | Total (USD) |
|---|---|---|---|---|
| Light path in the order the light meets it, as in the optical layout | ||||
 LED |
600 nm, 5 V, no internal resistors | 0.20 | 1 | 0.20 |
 Paralleling lens |
Plano‑convex, SIGMAKOKI SLSQ‑12.7‑40P: synthetic fused silica, ø12.7 mm, f = 40 mm, design λ 546.1 nm, ne 1.460, uncoated | 100.00 | 1 | 100.00 |
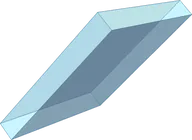 Beam splitter |
Coaxial beamsplitter cube, about 12 × 12 × 14.5 mm (from the CAD), 45°, 90% transmitted / 10% reflected | 40.00 | 1 | 40.00 |
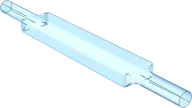 Flow cuvette |
2 mm inner diameter, 4 mm outer diameter, 76 mm long | 135.00 | 1 | 135.00 |
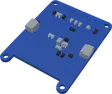 Lux sensor |
GY‑302 module (BH1750FVI): one for the sample, one for the reference | 2.00 | 2 | 4.00 |
| Electronics wired as in the wiring diagram | ||||
| Microcontroller | Arduino Uno Q | 70.00 | 1 | 70.00 |
| PCB | 2 × 8 cm prototype board | 1.00 | 1 | 1.00 |
| Transistor | UTC PN2222 | 2.00 | 1 | 2.00 |
| Resistors | 330 Ω, 1.2 kΩ and 10 kΩ, one of each used; bought as one pack | 1.00 | 1 | 1.00 |
| Wires | 20 AWG: 3 × (12 + 1) in black, 3 × (12 + 1) in red, 2 × (12 + 1) in green, 2 × (12 + 1) in blue, 1 × 24 in red, 1 × 24 in black | 0.10 | 12 | 1.20 |
| Heat‑shrink tubing | 2.0 × 45 mm | 0.10 | 2 | 0.20 |
| 2510 connectors | 2 × 5‑pin + 4 × 2‑pin female, 2 × 5‑pin + 4 × 2‑pin male, 18 crimp pins | 0.10 | 30 | 3.00 |
| DuPont connections | 10 female crimp pins, 2 × 5‑pin female housings | 0.10 | 20 | 2.00 |
| Male header pins | 10 bent, bridged together | 0.10 | 10 | 1.00 |
| Body and assembly the eight printed parts are in 10.2 | ||||
 Filament |
Black PLA and soft black TPU, printed as in 10.3 | not given | not given | not given |
| Screws and nuts | 4 × 5 mm 10‑32 screws, 2 × 10‑32 Nylock nuts | not given | 4 + 2 | not given |
| Roll of solder | Shared with the other instruments | shared | 1 | shared |
| Total, known costs | 360.60 | |||
The total is the sum of the known costs. The filament and the screws are not costed yet, and the roll of solder is shared with the other instruments.
Parts list, Slim photometer5 printed parts, 13 bought‑in
| Part | What it is | Qty | Unit cost |
|---|---|---|---|
| Printed parts (10.2; the numbers are the 3D model’s in 6.3) | |||
| 1 Body | Base plate and optical bench: the cuvette channel, sensor slots and windows. Black PLA. | 1 | not given |
| 2 Case | The lid over the bench; its 10° wedge is the foot. Black PLA. | 1 | not given |
| 3 Front clip | Clamps both fibers where they come in | 1 | not given |
| 4 Sample clip | Holds the sample fiber’s tip 1 mm from the cuvette | 1 | not given |
| 5 Reference clip | Holds the reference fiber’s tip at the empty chamber | 1 | not given |
| Light path and sensors | |||
| Fiber illuminator | Aluminum housing with the 600 nm LED; feeds both fibers | 1 | not given |
| Plastic optical fiber | Black‑jacketed, ⌀2.2 mm: one to the sample, one to the reference | 2 | not given |
| Heat‑shrink tubing | Black polyolefin over both fibers, from the illuminator to the body | 1 | not given |
| Lux sensor | GY‑302 module (BH1750): one for the sample, one for the reference | 2 | 2.00 |
| Flow cuvette | The same flow cell as the Pro: 2 mm path, 76 mm long | 1 | 135.00 |
| Screws | |||
| M3 × 8 | Socket‑head cap screws (ISO 4762): two per clip | 6 | not given |
| M4 × 12 | Button‑head screws (ISO 7380): hold the case | 2 | not given |
The electronics are the Pro’s: both builds use the same soldered PCB and Arduino Uno Q (8.1).
10.2 Design Files
The Pro photometer’s eight printed parts, numbered as in its 3D model (6.2), and the Slim photometer’s files.
The Pro’s eight STLsone per printed part
- 1LED mount
Holds the 600 nm LED.
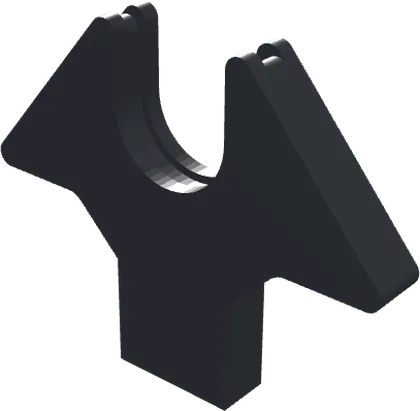
- 2Lens holder
Holds the paralleling lens, for a parallel beam.
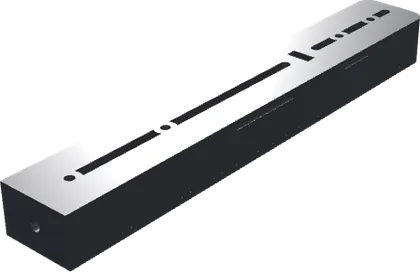
- 3Body
The column every part attaches to; sets the light‑travel distance.
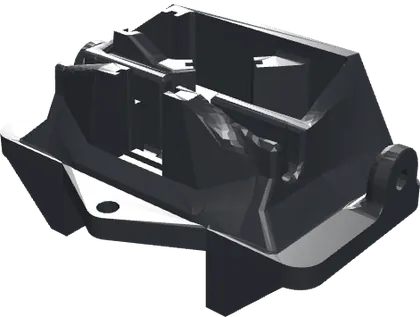
- 4Sensor frame
Holds the beam splitter and both sensors.
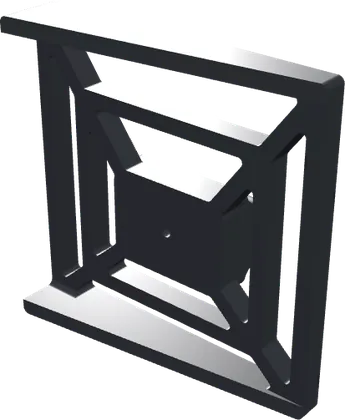
- 5Base
Angles the column 10° so bubbles clear.
- 6Body cover
Blocks outside light along the light path.
- 7Body cover, small
Blocks outside light along the light path.
- 8Sensor frame cover
Blocks outside light from the sensors.
Slim photometer
10.3 Print Settings
Print settings7 rows
From the slicer project in the doc’s assembly guide (Bambu Studio).
- Printer
- Bambu Lab X1 Carbon, 0.4 mm nozzle, textured PEI plate
- Profile
- 0.20 mm Standard @BBL X1C
- Layer height
- 0.2 mm, first layer 0.2 mm
- Sparse infill
- 20% gyroid
- Supports
- On: normal (auto), 30° threshold
- Top surface
- Line width 0.25 mm
- Filaments
- PLA Matte, TPU 95A and PETG-CF, on three plates. The guide prints plate 1 (the lens holder and sensor frame) in PETG, CF optional, and paints TPU onto its seats.