Data Physicalization

Data Physicalization. Team members in matching shirts explain a hand-made green and yellow relief map of Taiwan to visitors crowded around the booth table.

Abstract

Through the creation of a map and sound physicalization, we invite the public to see, feel, and interact with patterns of environmental stress throughout Taiwan rather than staring at plain data and graphs.

Paper color shows crop yield and flashing LEDs represent plant stress severity. Visitors were curious on why Yilan and Nantou had the highest stress. Many believed that regions such as Taipei would have the most stress instead. Most were fascinated or surprised by the fact that plants make clicking noises when they lack water. Just over half of visitors read the map correctly on a single, brief encounter. Next time, we will put a legend beside the board that shows three flash speeds and what each one means.

Contents

On this page

Overview

Data Physicalization

Data physicalization is the practice of transforming abstract datasets into tangible physical artifacts, such as models, sculptures, or interactive maps. Instead of viewing numbers on a 2D screen or standard graph, people can interact with data through their senses. By using physical elements like colors, sound, and lights to represent real-world variables, data physicalization bridges the gap between complex information and human intuition, making critical insights much more accessible, memorable, and impactful.

Goals

Climate change is putting more heat and drought stress on Taiwan’s crops, but people do not notice it until prices of certain food crops start to rise in the market. To really feel the gravity of climate warnings and make their effects on plants more tangible, we developed a data physicalization map and a website where the public can hear the sound plants make when facing stress. Through the creation of a map and sound physicalization, we invite the public to see, feel, and interact with patterns of environmental stress throughout Taiwan rather than staring at plain data and graphs. With data physicalization, we aim to make the interaction between agriculture, climate, and plant stress more accessible and easy to understand.

Why physicalize?

“A data physicalization (or simply physicalization) is a physical artifact whose geometry or material properties encode data” (Jansen). Data physicalization helps people communicate and understand data through physical representations. These visualizations help convey the data in a more accessible way (Jansen). Our data map physicalization is a type of physical visualization where map data are converted to a physical form.

The data

Rather than selecting data solely because it was readily available, we considered which variables could best communicate the environmental stresses relevant to our project and our target agricultural communities. The board uses two county-level datasets: rice yield and heat stress. We chose heat because it is one of the stresses ReLEAF protects against, and yield because it shows what that stress costs farmers. We first found the patterns in the data that matter most for plant stress, then chose a physical feature of the map to show each one. This allowed every component of our map to remain connected to the dataset, making the information easier to understand through physical interaction.

The maps and data sources behind the board are on the Geospatial Analysis page.

From data to map

Paper color shows crop yield and flashing LEDs represent plant stress severity. Through this combination, viewers can visually compare areas with different agricultural conditions. Many visitors expected Taipei to show the most stress, and asked why Yilan and Nantou did.

For our sound component, instead of just showing data, we wanted participants to actually hear what sounds are made by plants under stress. Plants respond to stress in ways people cannot see; few people know that a plant under drought stress makes sounds. We therefore allowed participants to use headphones to listen to recordings of the sounds produced by tomato and tobacco plants experiencing drought stress. This gave participants an opportunity to understand plant stress through hearing rather than simply reading about it.
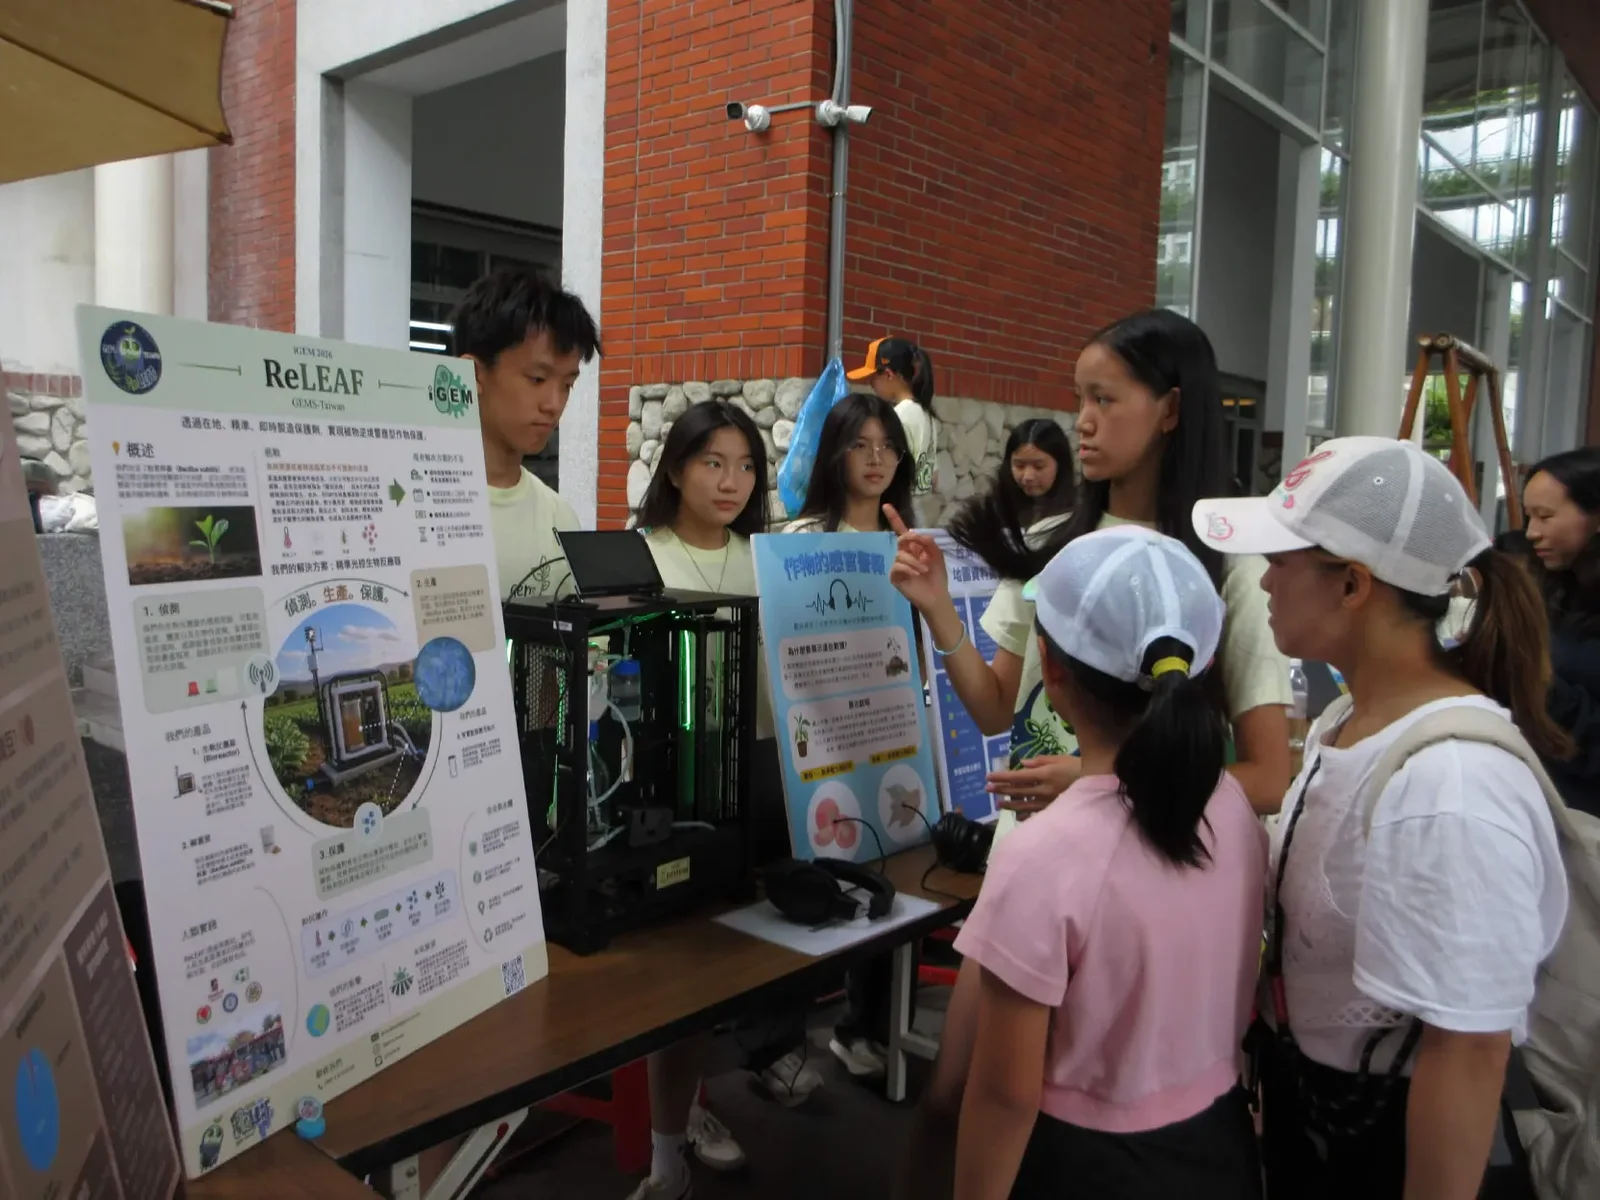
The ReLEAF booth at an outdoor market. A team member points at a blue poster headed 作物的感官警報 while visitors, two of them children in caps, look on. The bioreactor prototype sits on the table beside a pair of headphones, next to the project poster.
Figure 1 The data physicalization booth at our public forum. The blue board on the right is the sound exhibit, with the headphones on the table in front of it for listeners.

Physicalizations

Stress map

Concept and inspiration

Our data physicalization was inspired by the idea that scientific data should not only be seen, but also experienced. Plant stress is often difficult for people to understand because many of its effects occur at a microscopic or molecular level and cannot be directly observed. We wanted to transform these invisible changes into interactive experiences that could make plant stress more tangible and accessible to the public.

Our physicalizations were designed around different ways of experiencing data, including visual representations and hands-on interaction. By translating scientific information into sensory experiences, participants could explore how plants respond to environmental stress rather than simply reading about it on a poster. This approach also reflects the core idea of our ReLEAF project: connecting complex biological signals with information that people can easily understand and respond to.

  1. Physicalization method

    We created the physical map using styrofoam as the base material, with different colored papers placed on top to represent variations in crop yield. LED lights were incorporated into the map to visualize plant stress levels. The map shows the different regions and turns the data into something tangible.

    The color gradient was designed to make differences in crop yield immediately recognizable:

    • Dark green → areas with plentiful/high crop yield
    • Brown → areas with the lowest crop yield
    • Intermediate colors → areas with varying levels of crop yield

    LED lights were used independently to represent plant stress. The frequency or amount of LED flashing increased with the severity of stress, allowing viewers to distinguish between areas experiencing different levels of environmental stress. The more frequent the LED flashes, the more stress crops in that region experience.

    For the sound physicalization, participants were provided with headphones and invited to listen to recordings of drought-stressed tomato and tobacco plants. Instead of visually representing the data, this activity allowed participants to hear signals associated with plant responses to drought stress.

    By combining a physical map with an auditory experience, we created two different ways for participants to interact with otherwise invisible plant-stress information.

  2. Mapping data to physical elements

    We mapped each type of data to a physical or sensory element so that participants could interpret the information without needing to understand complex datasets.

    DataPhysical elementRepresentation
    Crop yieldColored paperDark green represented highest crop yield; brown represented the lowest crop yield
    Plant stress levelLED lightsMore frequent flashing meant more severe stress

    The physical map therefore allowed participants to understand two variables simultaneously. Color represented the outcome, crop yield, while LED activity represented the stress experienced by plants. This distinction helped demonstrate that environmental stress can have tangible consequences for agricultural productivity.

    The sound activity approached the same concept from a different perspective. Rather than showing participants a number or visual indicator of drought stress, we allowed them to directly hear the sounds associated with stressed plants. This helped emphasize that plants actively respond to their environment, even when those responses cannot normally be perceived by humans.

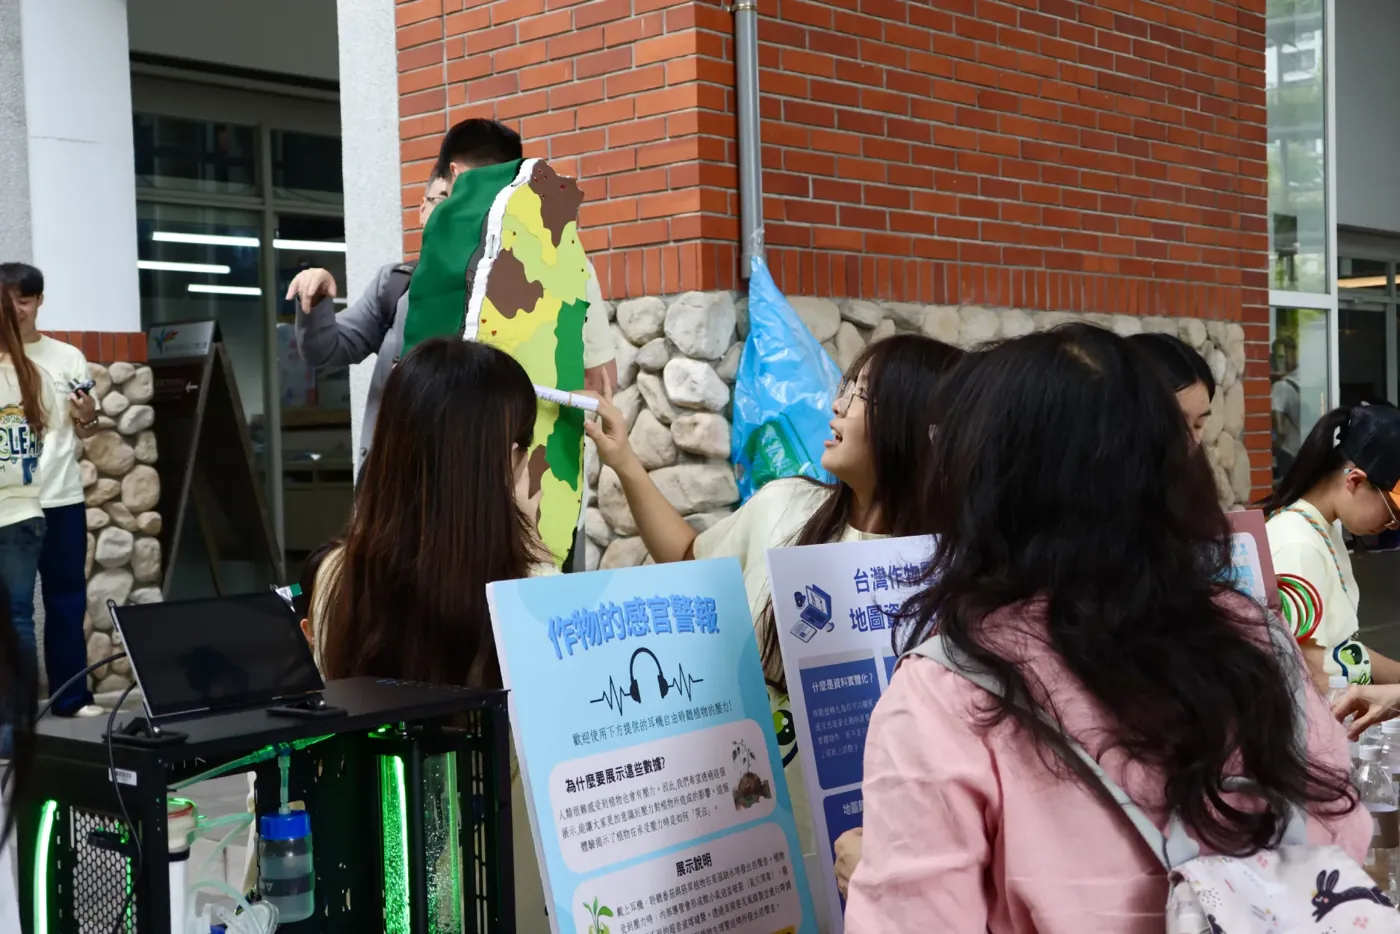
    A team member holds the styrofoam map of Taiwan up against a brick wall while visitors crowd in front of it. The island is covered in dark green, yellow-green and brown paper. In the foreground a laptop and the blue sound-exhibit board stand on the table.
    Figure 2 The stress map held up for visitors at the booth, with the sound exhibit’s board in front of it.
  3. Public interaction

    Throughout the booth, visitors were curious on why Yilan and Nantou had the highest stress. Many believed that regions such as Taipei would have the most stress instead. We explained the tourism in Nantou and Yilan were affecting its stress level along with their geography with Nantou being located near the steep mountainous range where crops are prone to loss through landslides caused by erratic rainfall as well as typhoons and Yilan being located right by the coast where salinity levels are higher. Visitors vocalized their curiosity when they noticed our poster since the data may not align with what they had thought the most affected regions were.

Feedback

The feedback we got that addressed the stress map was the fact that areas that receive stress were easy to see on the map due to its frequent flashing lights. Through this, we were able to teach the Taiwanese public more about their own country and inform them about the effects climate change has on our local agriculture.

Original (Chinese)Translation
原來宜蘭縣對植物壓力最大I learned that Yilan County has the highest plant stress

Sound of plants

Concept and inspiration

Plants respond to stress in ways that are often invisible to the human eye until visible damage has already occurred — but recent research has shown that some of these responses aren't entirely silent. Under drought stress, plants can produce ultrasonic clicking sounds, signals that exist far outside the range of human hearing and go completely unnoticed in everyday life. We wanted to explore this hidden dimension of plant stress as a companion to our Data Physicalization Map: while the map translated environmental data into something visitors could see, we wanted to give people a way to actually hear plant stress for themselves. By making these normally imperceptible signals audible, we hoped to make the experience of plant stress feel immediate and real, rather than abstract, and to reinforce ReLEAF's core idea that stress can be detected and responded to before it becomes visible, irreversible damage.

  1. The idea of letting visitors experience the sounds plants made under stress first started when we came across a scientific paper that focused on how plants make sounds that are not audible to humans under stress. After finding this paper, we realized how impactful it would be if the public realizes how plants can also sense stress inflicted upon them. When facing drought stress, which is the stress that we presented during our public forum booth, plants experience a physical process called cavitation, where continuous water columns inside the plant snap and form air bubbles.

    How researchers captured it:

    Ultrasonic microphones.

    The pops sit far above human hearing, so Khait, Hadany et al. (Tel Aviv University) recorded across 20–250 kHz, about 10 cm from each plant.

    A soundproofed chamber first.

    Tomato and tobacco recorded three ways: untouched, five days without water, and freshly cut.

    Then a working greenhouse.

    Repeated amid ordinary background noise to prove it wasn't a laboratory artifact.

    Machine learning.

    A classifier trained on many acoustic features — not one number — separated stressed from healthy, drought from cutting, and tomato from tobacco.

  2. Physicalization method

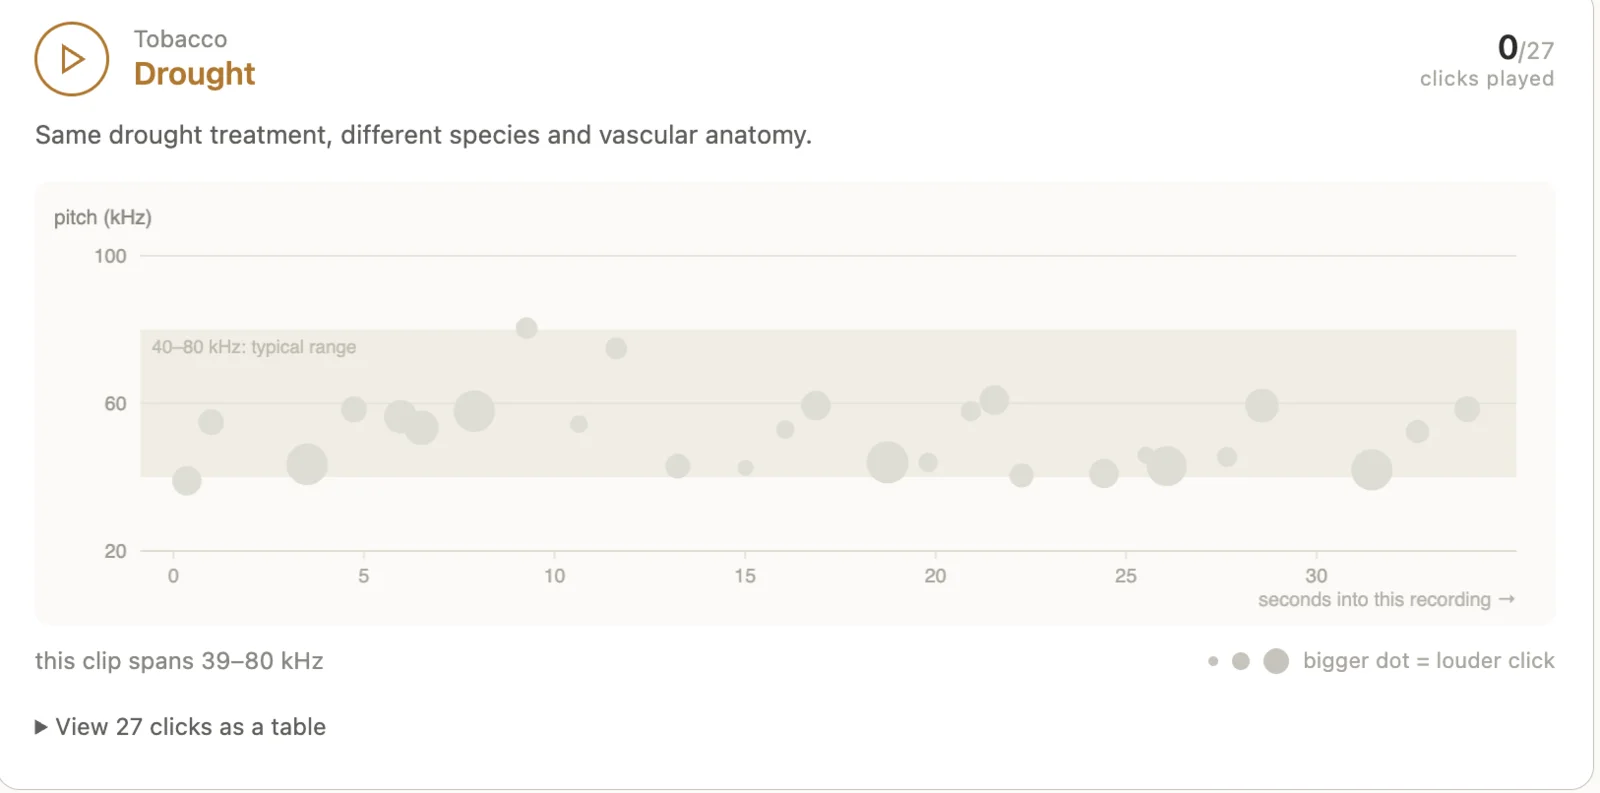
    To transform plant stress into an accessible sensory experience, we used the open recordings from Khait et al. (2023). The clicks are ultrasonic, so we shifted their pitch down into the range people can hear. We built a website to play them, and at the booth two headphones were connected to laptops hidden behind the poster. Participants could choose which plant they wanted to explore, either tobacco or tomato, and listen to their corresponding stress recordings through the headphones. By presenting plant stress through sound, we aimed to provide visitors with a more immersive way to understand that plants respond to environmental stress, even when these responses cannot be directly heard by humans.

    Screenshot of the listening site. A header reads Tobacco, Drought, with a counter showing 0 of 27 clicks played. Below it a scatter plot of pitch in kilohertz against seconds into the recording, with a shaded band marked 40 to 80 kilohertz typical range, and a note that bigger dots mean louder clicks.
    Figure 3 Sound of plants played for the listener. Open the listening site to hear the tomato and tobacco recordings.
  3. Public interaction

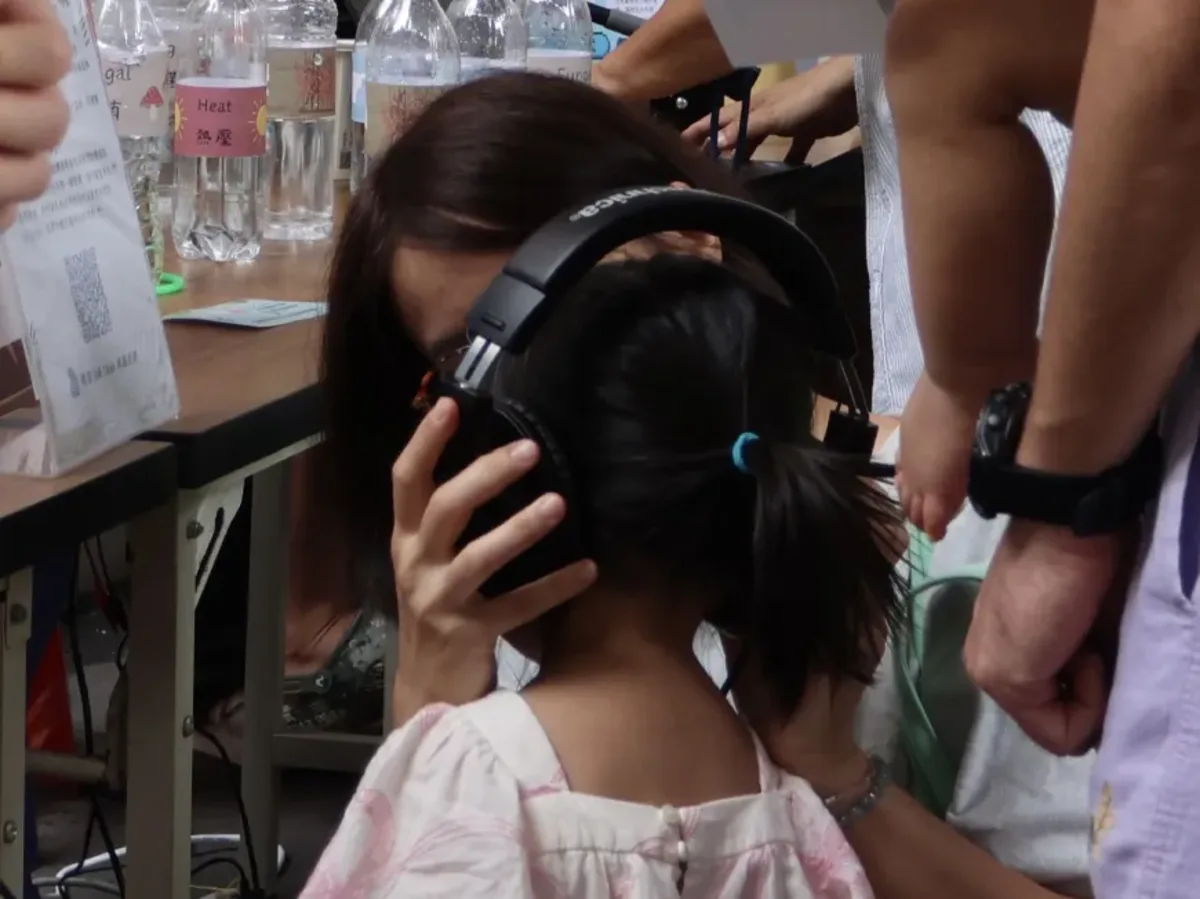
    When presenting our sound physicalization, many were fascinated with the fact that plants made noises when facing stress. We explained that a dry plant pulls hard on the water in its stem, and the water column can snap and form an air bubble. Each snap makes a pop, similar to the sound of bubble wrap. Overall, the public was intrigued with the demonstration and gave positive feedback.

    A young child at the booth, seen from behind, wearing large over-ear headphones held in place by an adult beside her. Behind them on the table stand labelled water bottles.
    Figure 4 A young visitor listening to the sound of a drought-stressed plant.

Feedback

After they finished visiting our booth, visitors were asked to give feedback on the overall event. Most were fascinated or surprised by the fact that plants make clicking noises when they lack water, and some even mentioned how the sound physicalization was the most memorable part of the whole booth.

Original (Chinese)Translation
植物缺水會發出咔咔聲Plants make a clicking sound when they lack water
聽到作物的壓力聲音印象深刻Hearing the crop's stress sound was the most memorable part
原來植物在遇到困難危險時會發出聲音learned that plants actually make sounds when facing stress/danger
知道植物缺少水分的時候居然會發出聲音I was surprised to learn plants make sounds when they lack water

Impact

At the end of the event, visitors who had been to all six booths filled in one survey. 62 of the 116 people who visited our booth answered it. Two questions were about the map itself; the rest covered the whole event.

Connecting data to plant stress: knowledge

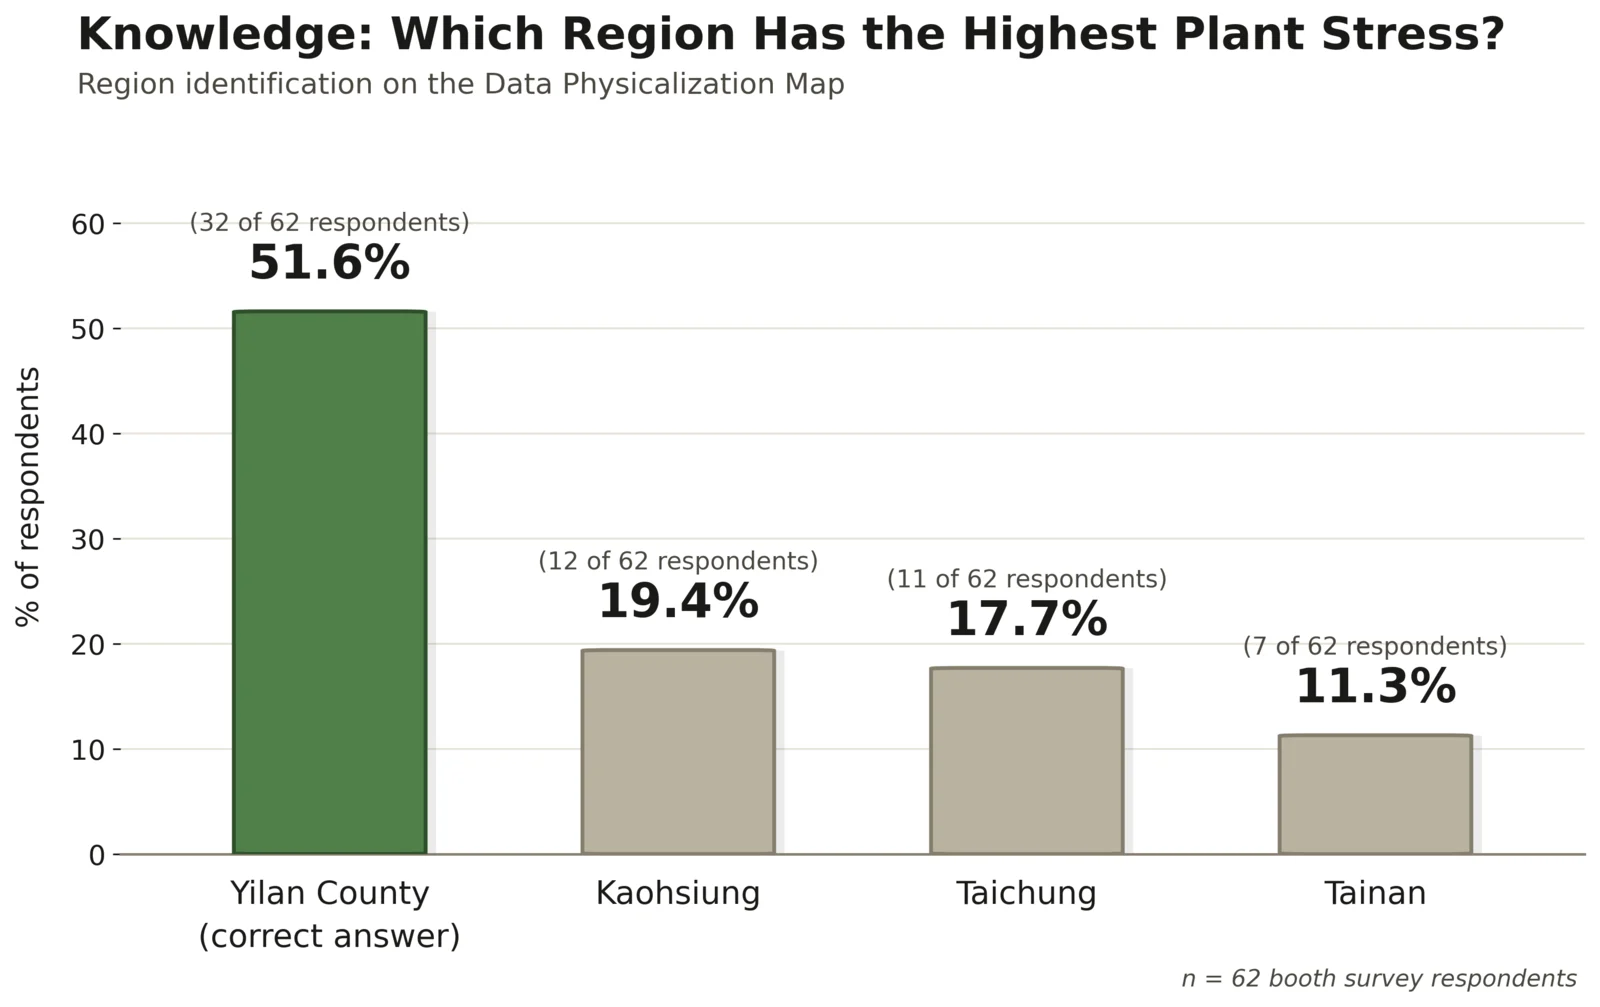
To test whether participants actually understood our physicalized data, we asked them to identify the region shown as experiencing the highest plant stress on our map. 32 of 62 respondents (51.6%) correctly identified Yilan County, the region we represented as highest-stress. The remaining responses were split across Kaohsiung (12, 19.4%), Taichung (11, 17.7%), and Tainan (7, 11.3%). Yilan’s high stress amount was showcased through its frequent flashing of LED lights.

Just over half of visitors read the map correctly on a single, brief encounter — a reasonable result for a passive booth interaction, but it also points to a concrete design target. Next time, we will put a legend beside the board that shows three flash speeds and what each one means. We will then check whether more than 80% of visitors pick the right region, to showcase that our data physicalization actually conveyed information to the public.

Bar chart titled Knowledge, which region has the highest plant stress. Yilan County, marked as the correct answer, is the tallest green bar at 51.6 percent, 32 of 62 respondents. Kaohsiung is 19.4 percent, Taichung 17.7 percent and Tainan 11.3 percent, all in grey.
Figure 5 Showcasing knowledge of the region with the highest stress.

Raising awareness: attitude

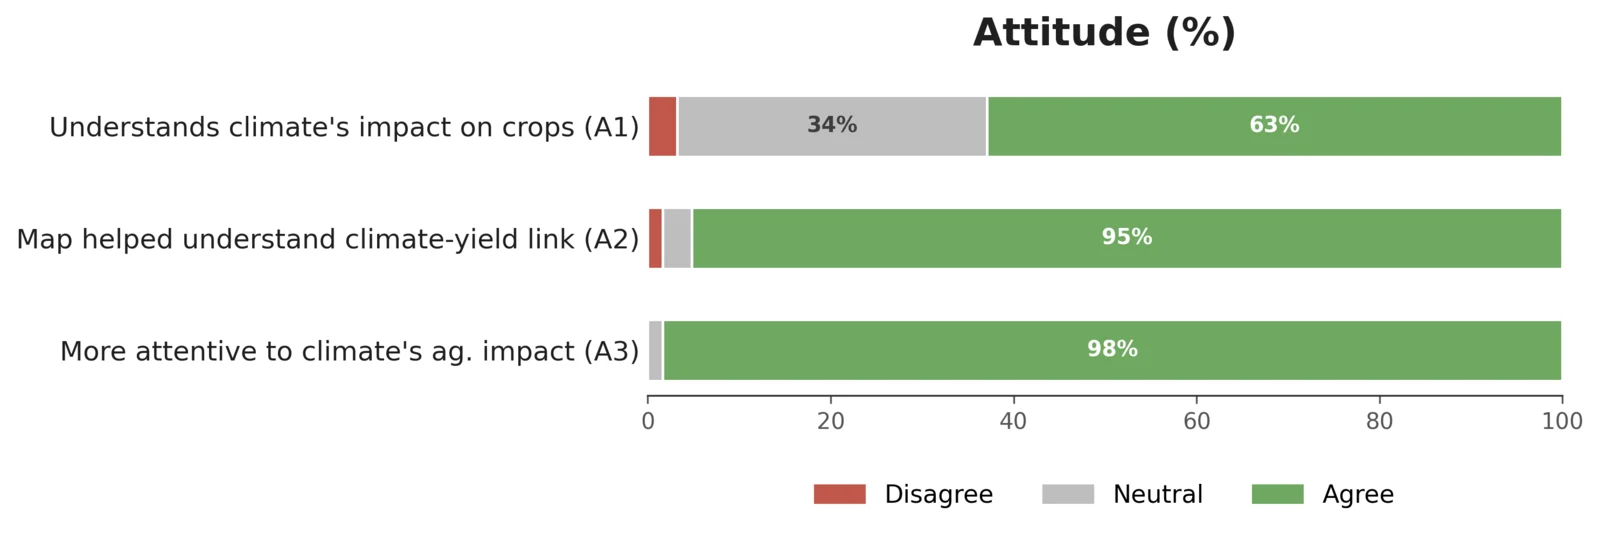
Horizontal stacked bar chart titled Attitude. Understands climate's impact on crops: 63 percent agree, 34 percent neutral, 3 percent disagree. Map helped understand the climate to yield link: 95 percent agree. More attentive to climate's agricultural impact: 98 percent agree.
Figure 6 Showcasing the percentage of participants that understood the impact of stress.

We then looked at whether the exhibit changed how participants understood the consequences of environmental stress for agriculture. 39 of 62 participants (62.9%) reported they now “very much understood” the impact of climate change on Taiwan's coffee and crop production, and another 21 (33.9%) said they understood it “partially.” Only 2 (3.2%) said they still didn't understand it well.

The physicalization itself was directly credited for this: 59 of 62 participants (95.2%) agreed or strongly agreed that the Data Physicalization Map helped them understand the relationship between climate change and crop yield — including 36 (58.1%) who strongly agreed. Only 2 respondents were neutral and 1 disagreed.

95.2% of participants agreed our Data Physicalization Map helped them understand the relationship between climate change and crop yield.

The sound layer reinforced this on the qualitative side. When we asked what was most memorable, one participant wrote “知道植物缺少水分的時候居然會發出聲音” (“I was surprised to learn plants make sounds when they lack water”). For these visitors, hearing the clicks made plant stress real. Several noted their surprise that a water-stressed plant produces audible clicking sounds, or named the sound of a stressed crop as the most striking part of the visit. This suggests the auditory channel was doing real cognitive work, not just serving as ambience: for some visitors, the sound was the moment the abstract idea of “plant stress” became concrete.

From awareness to action: practice

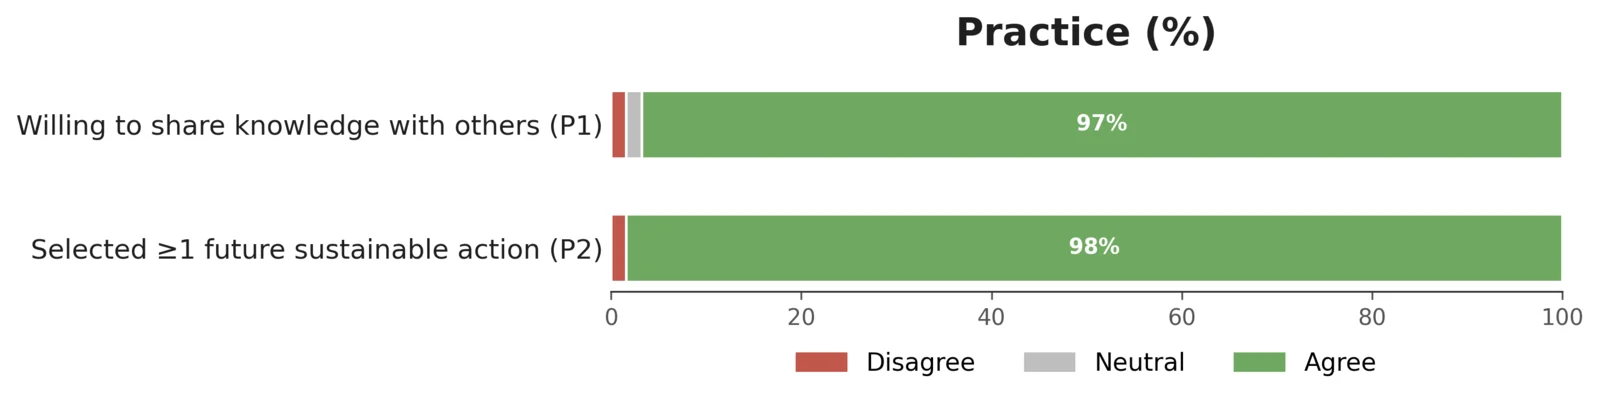
Horizontal stacked bar chart titled Practice. Willing to share knowledge with others: 97 percent agree. Selected at least one future sustainable action: 98 percent agree.
Figure 7 Percentage of people willing to perform further actions.

Finally, we looked at whether this understanding translated into intended behavior. 60 of 62 participants (96.8%) said they were willing or very willing to share what they'd learned about crop protection and agriculture with friends or family.

Participants also indicated concrete future actions (multi-select):

  • 49 (79.0%) — prioritizing locally produced or sustainably farmed agricultural products/coffee
  • 37 (59.7%) — following and sharing climate-and-agriculture information
  • 18 (29.0%) — joining more science-outreach or environmental activities

Open-ended responses echoed this: participants wrote in their own words about supporting local farmers and coffee growers, reducing carbon footprints, conserving water and energy, cutting plastic use, and educating others about climate impacts on plants.

Summary

Together, the three parts of the survey show what visitors understood, how their views changed, and what actions they would take. Most said they would share what they learned and would buy local farmed food. By turning invisible environmental stress into something visitors could see and hear, the exhibit made an otherwise abstract problem tangible enough that most participants left not just informed, but reporting an intention to change their own behavior.

Conclusion

Our data physicalization booth helped us achieve our goal of making plant stress and synthetic biology more accessible, interactive, and understandable to the public. By presenting data beyond just a graph, we transformed plant-stress data into experiences that visitors could directly see, hear, and interact with. For example, our sound physicalization allowed participants to listen to recordings of stressed tobacco and tomato plants, turning an otherwise invisible biological response into something they could experience themselves. Additionally, according to our surveys, many people became more knowledgeable and aware of the effects of plant stress, with many claiming that they would relay the dire situation to family and friends as well. The physicalizations helped us bridge the gap between complex scientific concepts and everyday experiences, supporting our broader iGEM goal of communicating science beyond the scientific community.

After this event, we still wanted to continue raising awareness about the effects climate stress has on our local crops. Through social media outlets such as Instagram, we began promoting a plant stress event where participants upload a picture of a stressed plant they see during their everyday life. We hope through social media, we can reach a greater audience and spread our concerns internationally, beyond Taiwan.

The rest of the public forum, what we’ve gained, and what we’ve changed because of it is on the Integrated Human Practices page.

References

  1. Khait, I., Lewin-Epstein, O., Sharon, R., et al. (2023). Sounds emitted by plants under stress are airborne and informative. Cell, 186(7), 1328–1336. doi:10.1016/j.cell.2023.03.009. Recordings via Dryad (CC0).