
Overview
ReLEAF brings together synthetic biology, plant experimentation, optogenetic control, continuous monitoring and membrane-based bioreactor engineering. We did not evaluate each component only in isolation. We aimed to test the major steps required for our proposed system to function: producing our protectants, evaluating their effects on plants, controlling biological activity with light, monitoring bacterial growth, releasing protectant through our bioreactor, and retaining engineered Bacillus subtilis within the system.

Wet lab and dry lab
01Stress detection
Nothing new at the benchThe models were scored on bioreactor runs the bench had already recorded, so this stage ran no experiment of its own.
Warning and forecastOur software spotted a failing sensor 26.7 hours before its readings gave out, and the growth it predicted 13 days in advance proved right. The leaf sensor beside the crop still reads too warm to trust.
02The green light switch
Cells under the lampUnder the green lamp the bacteria grew and made the protectant from 2 to 16 hours, but brighter light did not give us more of it.
The lampWe built the lamp: a plate that lights twenty-four small cultures at once under six fixed light conditions.
03Making the protectant
DNA builtFourteen pieces of DNA built and checked, and a working way of getting them into our bacterium, Bacillus subtilis.
DNA designedEvery one of those DNA sequences was designed on a computer first, down to the individual codons.
04Watching the culture
The reactor runSix bioreactor runs between June and October, with the bacteria growing for days at a time.
The reactor readThe light sensor that reads the culture without opening the vessel: it matched the laboratory instrument closely and ran 434 hours unattended.
05Does it help a plant
Plants testedTreated Arabidopsis seedlings held on to more chlorophyll than untreated ones at every level of salt stress.
Dose worked outA model that works out how much protectant a field needs, and when it has to arrive to do any good.
06The whole machine
Protectant releasedThe protectant itself was found on the far side of the membrane that keeps the bacteria inside the vessel.
Run watched liveOur software followed that run while it happened, reading the sensors live.
Stress detection and prediction
Can sensor and weather data be turned into a decision about when to produce and when to apply?
Our planned interface puts a variety of inputs through AI, which assembles instructions for farmers on protectant application while actively monitoring conditions inside the machine. Our AIoT system is also what produces our protectant, activating the green light during optimal application windows.
We evaluated three models using data collected from our own experimental runs: a fault detection model to identify irregularities in sensor readings, a short-term model to predict culture density, and a growth prediction model that applies findings from the light plate to the bioreactor. Details on the system architecture, model training, and interface are available on our Digital Twin page. The five endpoints below summarize what those models and the field sensors returned.
| Endpoint | Tested on | Result |
|---|---|---|
| Fault detection lead time | Run 3, 434 h | 26.7 h before the optical density channel failed |
| Forecast skill at 2 h | Run 4, 102 h | RMSE 0.040 against 0.067 for persistence, 41% better |
| Pre-registered growth rate | Run 6, 41.8 h | 0.286 ± 0.010 h−1, inside the 0.2705 to 0.3300 interval written down 13 days earlier |
| Leaf and air sensor agreement | 3 sites, 540 paired readings, 10 October | Leaf sensor reads 1.2 to 1.9 °C warmer in the same air; site means +0.47 to +1.71 °C, so no single offset corrects it |
| Leaf wetness channel | The same 540 readings | 0.0% in every sample; the sensor was never wetted, so the channel is untested |
Fault detection
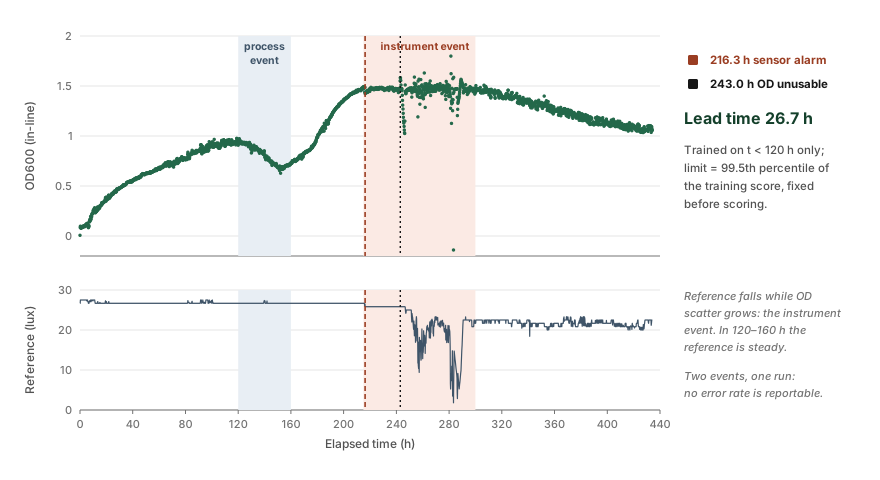
We trained an autoencoder on the first 120 hours of healthy data from run 3 to distinguish sensor faults from changes in culture growth. The model monitored the reference beam for sensor abnormalities and growth rate for process abnormalities.
Between 120 and 160 hours, the model detected process abnormalities in 73% of windows, consistent with a decline in culture density from 0.93 to 0.72. Between 220 and 240 hours, it detected sensor abnormalities in every window as the reference intensity dropped from 26.67 to 25.83 lux, while culture density remained stable. Neither period triggered false alerts on the other axis.
The model flagged the sensor issue at 216.3 hours, 26.7 hours before channel failure, with a 6.1% false-alarm rate on unseen normal data. Further details are provided in section 5.
Forecast skill
Along with this, we tested different forecasting methods for predicting bacterial growth and conditions.
We evaluated four forecasting models using 102 hours of continuous data from run 4. Starting at hour 12, each model generated hourly predictions using only the data available at that time. Their performance was compared against a persistence baseline, which assumes culture density remains unchanged.
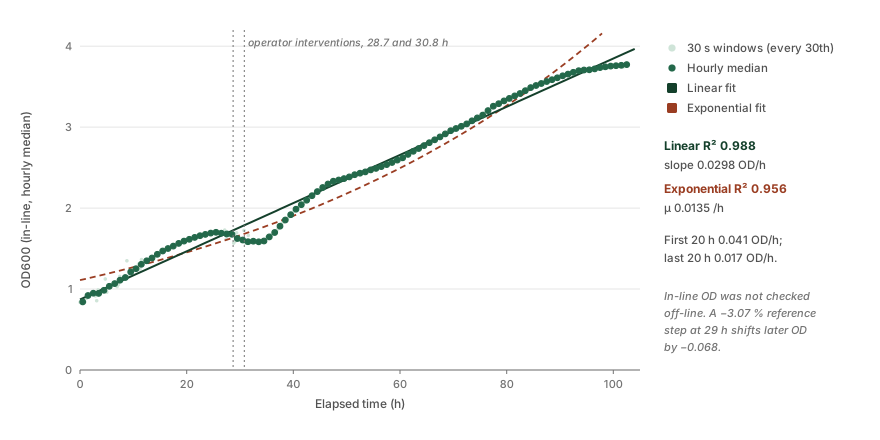
| Horizon | Persistence | Kalman | Better by |
|---|---|---|---|
| 2 h | 0.067 | 0.040 | 41% |
| 4 h | 0.132 | 0.083 | 38% |
| 8 h | 0.256 | 0.192 | 25% |
| 12 h | 0.373 | 0.310 | 17% |
Forecast accuracy decreased as the prediction horizon increased, but the models continued to outperform the persistence baseline up to 12 hours ahead. One limitation is that most measurements were taken above the range where optical density is proportional to cell concentration [5]. Therefore, the models predict photometer readings rather than actual cell density. However, this does not affect their relative performance, as all five models were evaluated using the same signal.
The registered prediction
To evaluate the model independently of its training data, we established a prediction and success criterion on 1 October, before conducting any bioreactor runs with B. subtilis WB800 secreting ACC deaminase. The prediction was based on a logistic growth model fitted to the light plate data in section 3. Because run 5 ended prematurely after ten hours, we evaluated the prediction using run 6 instead.
| Endpoint | Registered 1 October | Observed, run 6 |
|---|---|---|
| Specific growth rate | 0.2986 h−1, 90% interval 0.2705 to 0.3300 | 0.286 ± 0.010 h−1, R² 0.978 |
| Curve shape | Logistic, NRMSE below 15% [6] | Prior misses the first seven hours by 30% |
| Time to OD 0.5 | 6.1 h from an inoculum of 0.14 | 3.6 h |
The growth rate estimated from a 150 µL light plate well successfully predicted the rate observed in a one-litre perfusion loop 13 days later. However, the result has two limitations. First, the model was fitted to only five hours of data, during which linear and exponential growth patterns were difficult to distinguish. Second, the secondary endpoints could not be evaluated because they relied on plate-reader measurements that had not been cross-calibrated with the inline cuvette, as noted when the criteria were established.
Field sensors
Our crop monitoring system uses leaf and air sensors to measure temperature and moisture conditions around the plant canopy. The difference between their readings helps identify whether the canopy is cooler and wetter than the surrounding air. On 10 October, we tested the sensors side by side without a leaf at three locations with stable air temperatures. We conducted three five-minute runs at each location, collecting 540 paired readings. Since both sensors were exposed to the same air conditions, their temperature readings were expected to match.
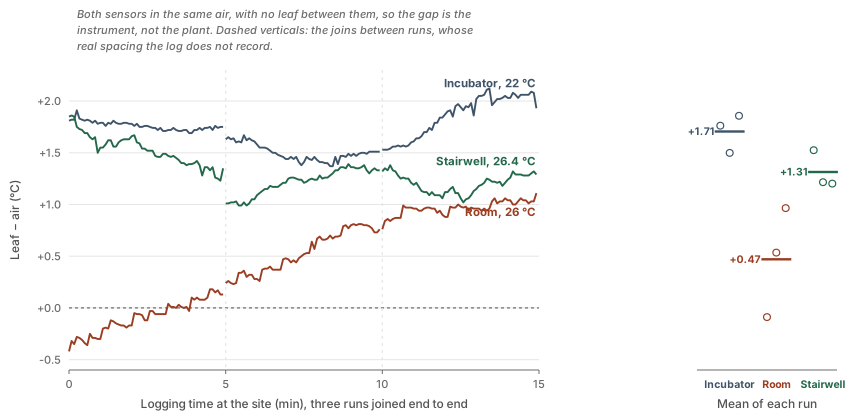
The air sensor matched the nominal temperature of every site, but the leaf sensor read 1.2 to 1.9 °C warmer once settled, and the size of that gap changed from site to site: +1.71 ± 0.20 °C in the incubator, +1.31 ± 0.19 °C in the stairwell and +0.47 ± 0.46 °C in the room, where the three runs ran from −0.09 to +0.97 °C. A gap that moves with the site cannot be corrected by one fixed offset.
This matters because leaf minus air temperature is one of the signals of water stress we intend to read. A bias of that size is large enough to hide the signal or to invent one, so it has to be measured and removed before the software acts on it. Leaf wetness read 0.0% in every one of the 540 samples; the sensor was never wetted, so that channel remains untested.
The forecasting system has also not been connected to the light-control system or tested for its effect on a culture, so end-to-end integration of these stages remains incomplete.
Optogenetic control
Can the light plate deliver a controlled signal for optogenetic activation?
ReLEAF depends on light as the external control signal connecting environmental prediction to biological production. We therefore tested the light plate to determine whether it could provide reproducible illumination across the culture area.
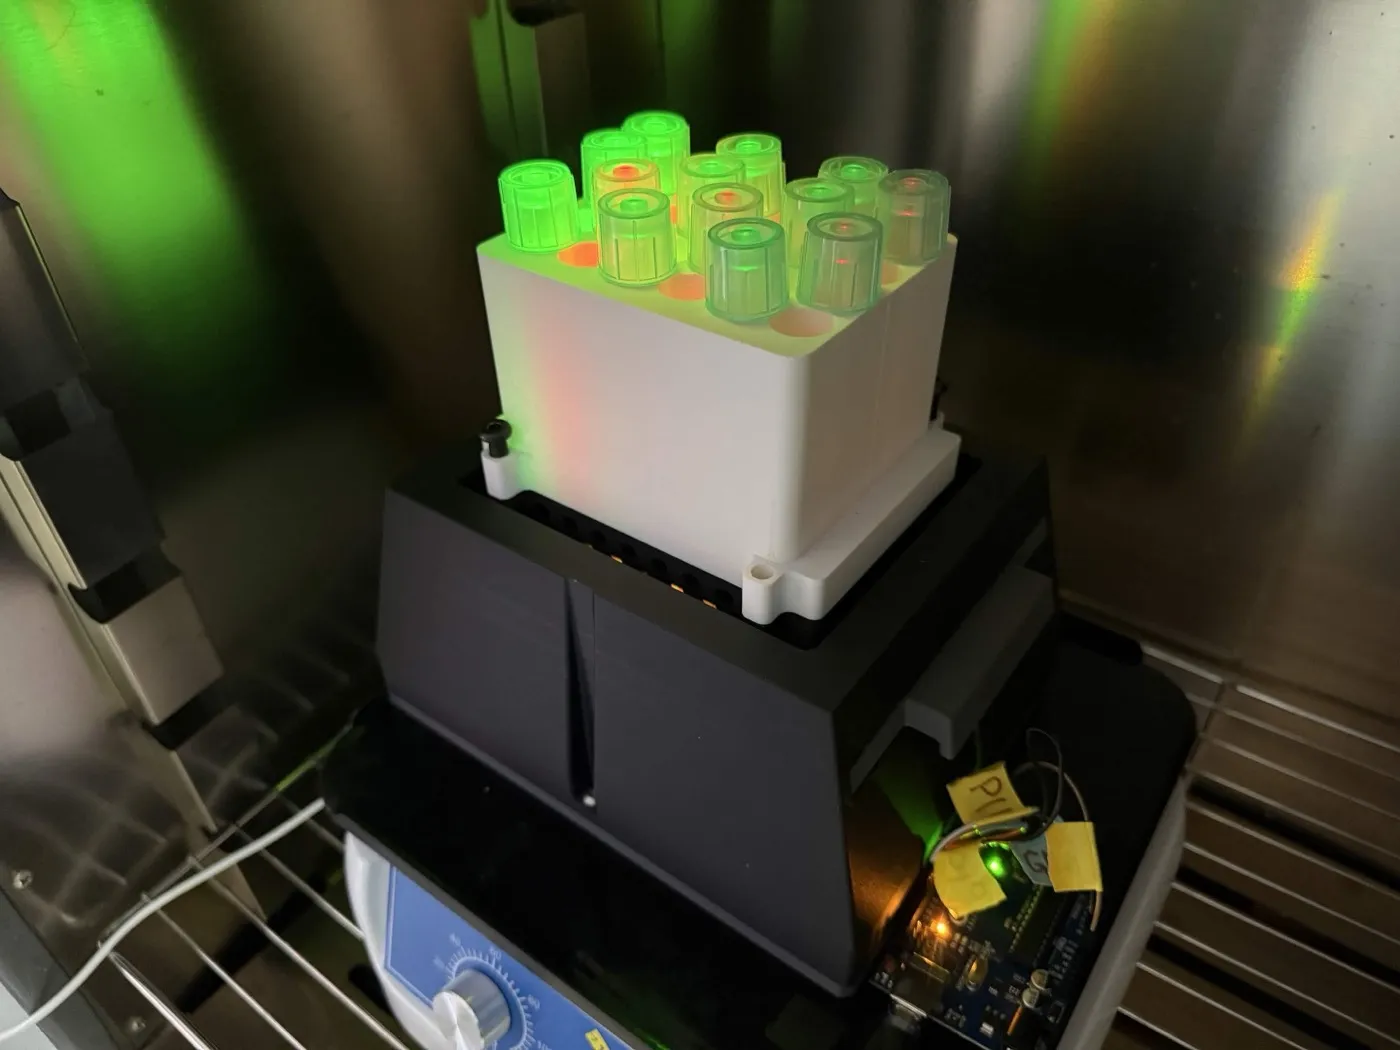
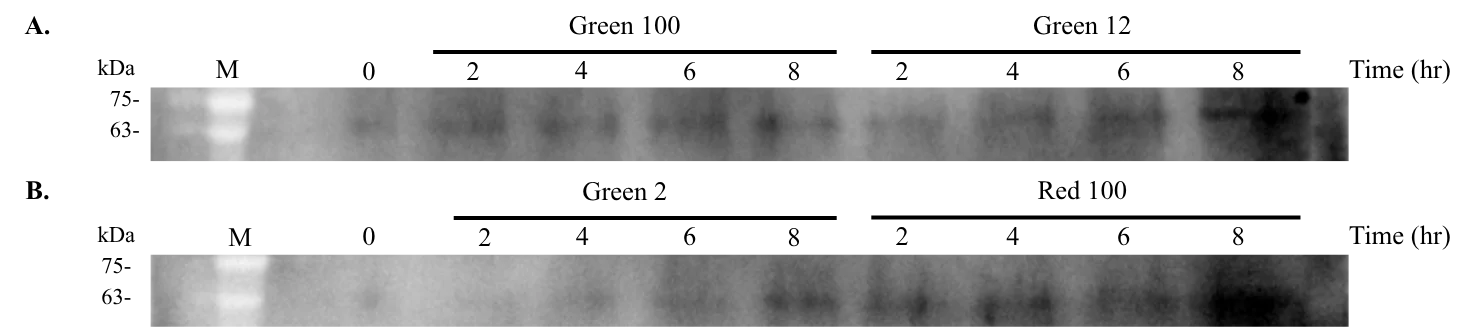
For our light plate apparatus we measured both OD600 and Western blot at two-hour intervals from 2 to 8 h, and once more at 24 h. Twelve tubes of B. subtilis WB800 carrying the CcaSR system were run on the plate at 2%, 12% and 100% light intensity. Each green intensity had three tubes, and each red intensity had one. At every time point, 100 µL of each tube went to OD600 and 100 µL to Western blot. The Western blot covers 0, 2, 4, 6 and 8 h, and the 24 h sample was read for OD600.
Growth under light
OD600 was read at 2, 4, 6, 8 and 24 h, and all six panels share the same axes. The top row shows red 2%, 12% and 100%, one tube each, and the bottom row green 2%, 12% and 100%, three tubes each.
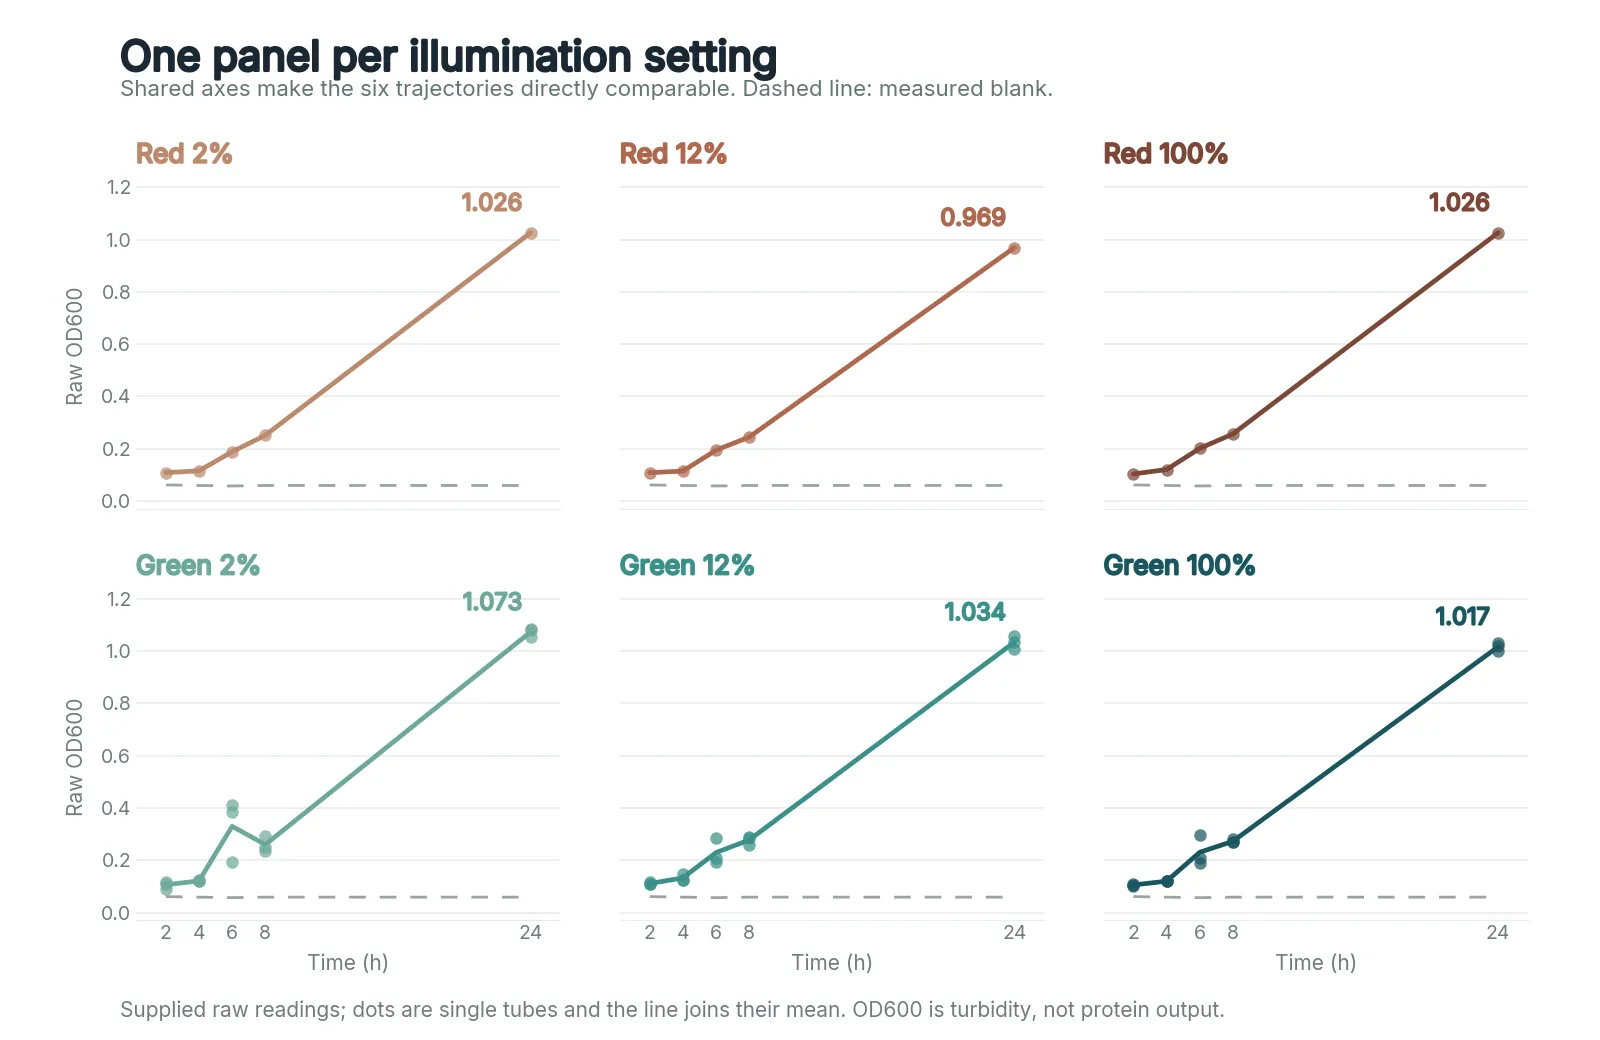
Through 8 h all six conditions grew alike, OD600 0.09 to 0.29, with more spread among green tubes at 6 h. At 24 h red 2%, 12% and 100% reached 1.026, 0.969 and 1.026, and green 2%, 12% and 100% reached 1.073, 1.034 and 1.017. Every tube ended between 0.97 and 1.08, red and green alike, so green light at any of these intensities neither helped nor hindered growth over a day. The run has not been repeated. OD600 reflects turbidity instead of specific protein output.
Protein over time
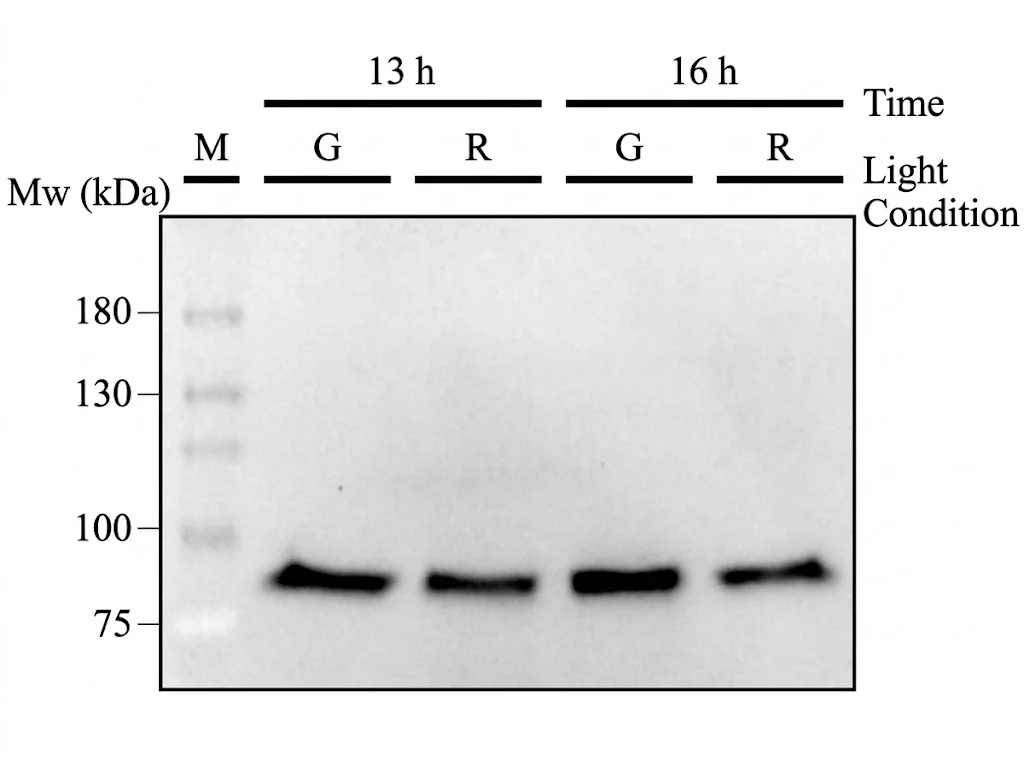
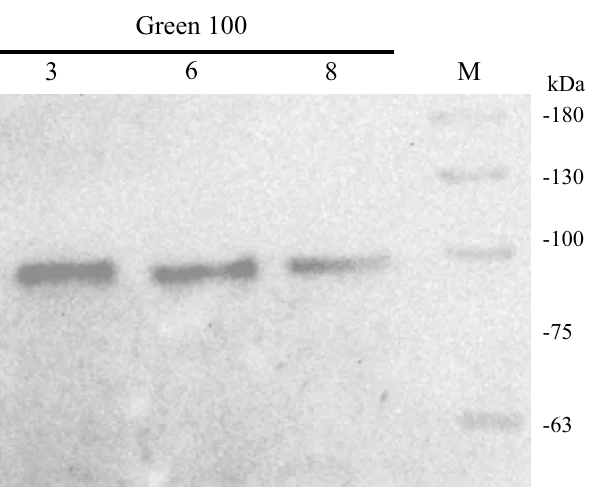
Western blotting was used to identify and measure ACCD produced after B. subtilis is exposed to different intensities of red and green light. Cultures were used in three ways: put directly into the plate and sampled every two hours from 0 to 8 h; put directly into the plate and sampled only at 13 and 16 h under green or red light at 100%; and grown overnight first, then moved into the plate under green light at 100% and sampled after 3, 6 and 8 h.
The first blot used wild-type AcdS, level 2 construct ABDI. The other two used the codon-optimised AcdS 2.1 variant, level 2 construct ABDQ, as will the remaining experiments. The reason behind this change was that the original AcdS did not expand well in liquid culture, so we had to repeat electroporation and the steps around it every time. AcdS 2.1 expands better and does not have this issue.
What it settles
The light plate held twelve tubes under matched red and green conditions, grew B. subtilis in all of them, and gave a readable ACCD signal on a Western blot, so it can serve as ReLEAF's light-control platform.
What the results do not yet show is a clean, graded response of ACCD to green light intensity: the red 100% reference was also strong at 8 h. Before we rely on light intensity as a control signal, we need to quantify the blot against a loading control, add a B. subtilis WB800 lane without the plasmid, and repeat the run. The 13 and 16 h pair has since been quantified by ELISA, green above red by 1.1 and 0.4 µg/mL, but that pair sets green against red at full intensity and says nothing about the graded series.
The light plate experiment also provided data for our growth prediction model. We fitted a logistic growth model to the 19 September results and used it to establish a growth rate prediction on 1 October. This prediction was later evaluated using bioreactor run 6, as described in section 2. It was the only prediction on this page established before the experiment used to test it.
Protectant production
Can our engineered B. subtilis produce the intended protectants?
Following stress detection and optogenetic signal delivery, the next stage of ReLEAF is biological production. Our system uses engineered B. subtilis, strains 168 and WB800, as the microbial chassis for producing plant-protective molecules in response to a controlled light signal. To make the system easier to construct, troubleshoot and adapt, we organised our genetic design into four functional modules.
Module 1 · PCB production — supplies the chromophore phycocyanobilin that CcaS-m3 needs in order to sense light
Module 2 · Light sensing — once loaded with PCB, CcaS-m3 detects green light and autophosphorylates
Module 3 · Transduction — CcaR takes the phosphoryl group from activated CcaS and switches on the output promoter
Module 4 · Light-responsive expression — turns green-light signalling into expression of the AcdS protectant
The system comes in two versions. Both share the first three modules and differ only in the light-responsive expression module: ccaSR–Csn–AcdS–Histag, and ccaSR–SamyQ–AcdS 2.1–Histag.
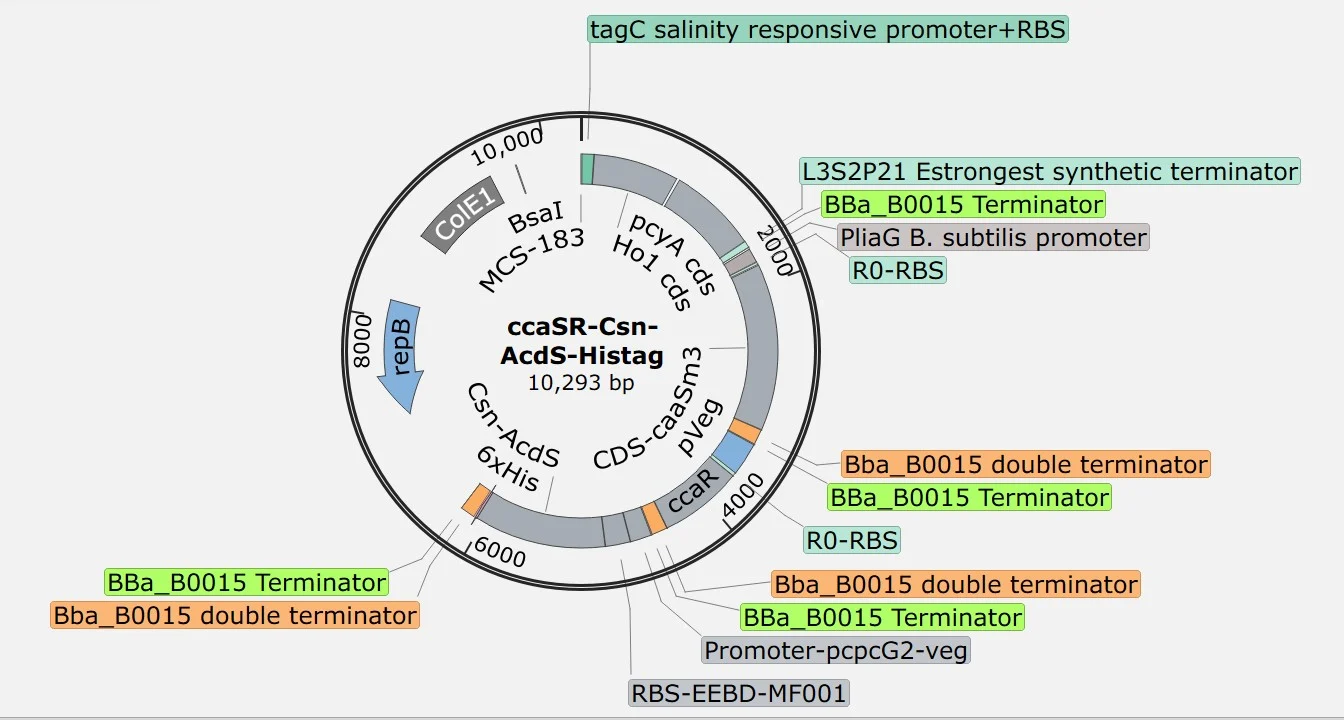
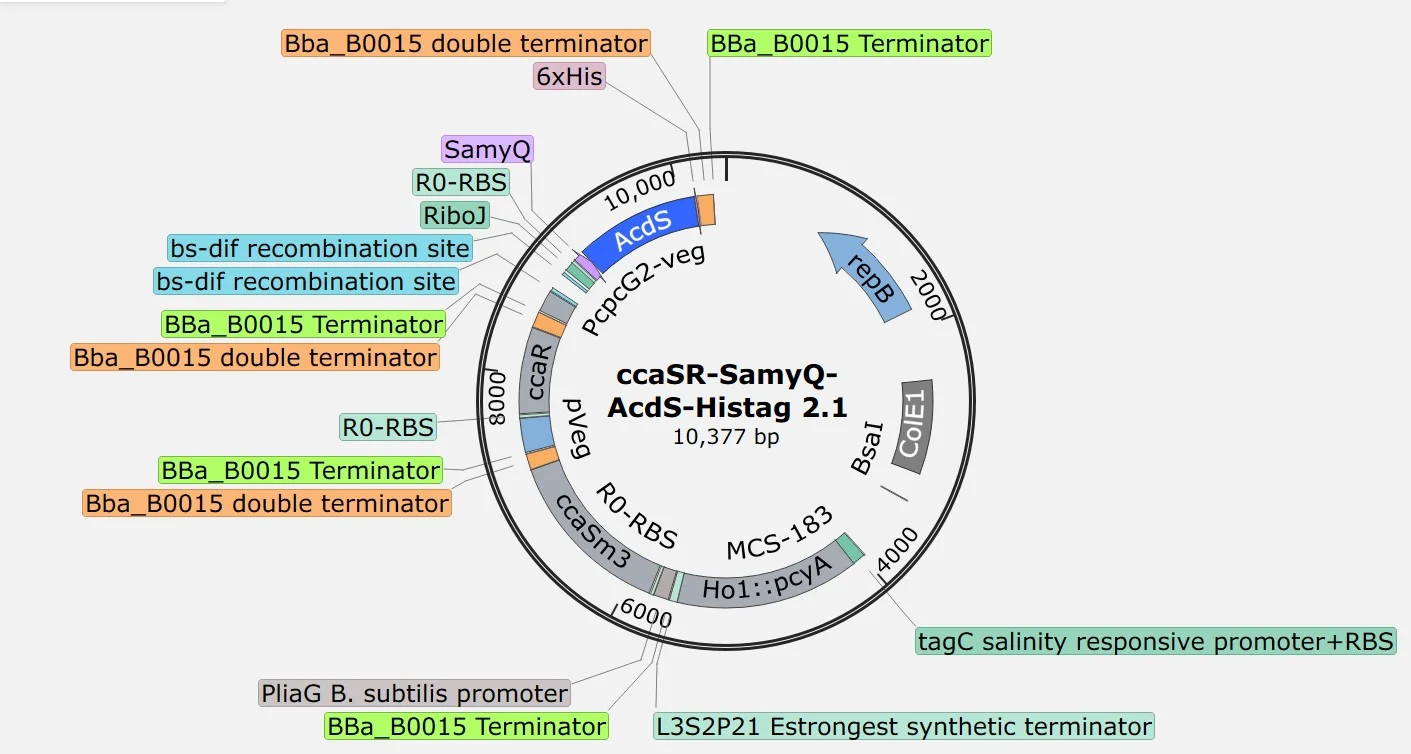
A fifth module, the production module, constitutively expresses the stress-mitigation proteins so that their maximal secretion and detection can be evaluated. It runs Pveg, EEBD–RBS0, a protectant coding sequence and B0015. The coding options are AcdS, LEA14 and BoPep4, each fused to a Csn or SamyQ secretion peptide and a 6×His tag, in wild-type, truncated and codon-optimised forms.
All modules were assembled using the SubtiToolKit Golden Gate system [3]. Detailed information on individual parts, sequences, and registry numbers is available on our Parts page.
Before carrying out further experiments and testing protein production, we first verified that our genetic constructs had been assembled correctly. The table below is every construct we built and the checks it passed.
| Construct | Colony PCR | Expected | Cross-module PCR | Sequenced |
|---|---|---|---|---|
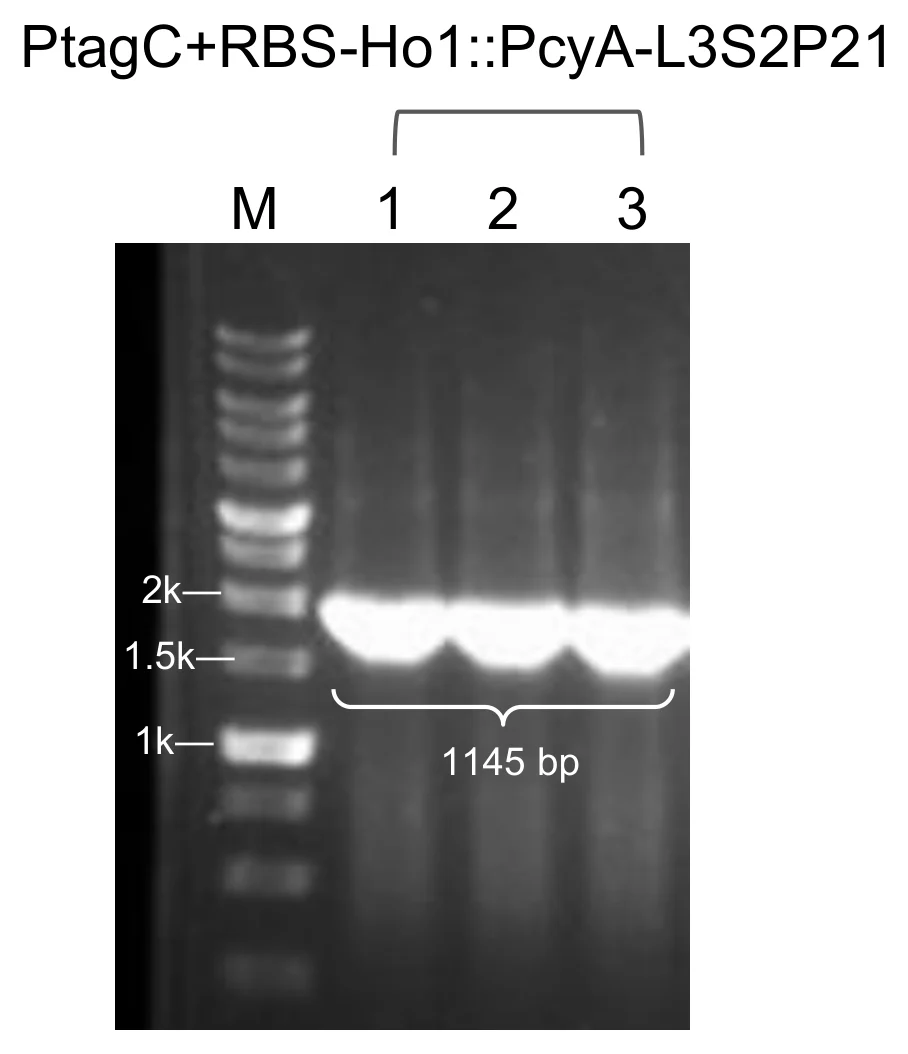
| Module 1 · PtagC+RBS–Ho1::pcyA–L3S2P21 | ✓3 of 3 | 1,145 bp | – | ✓clone 1 |
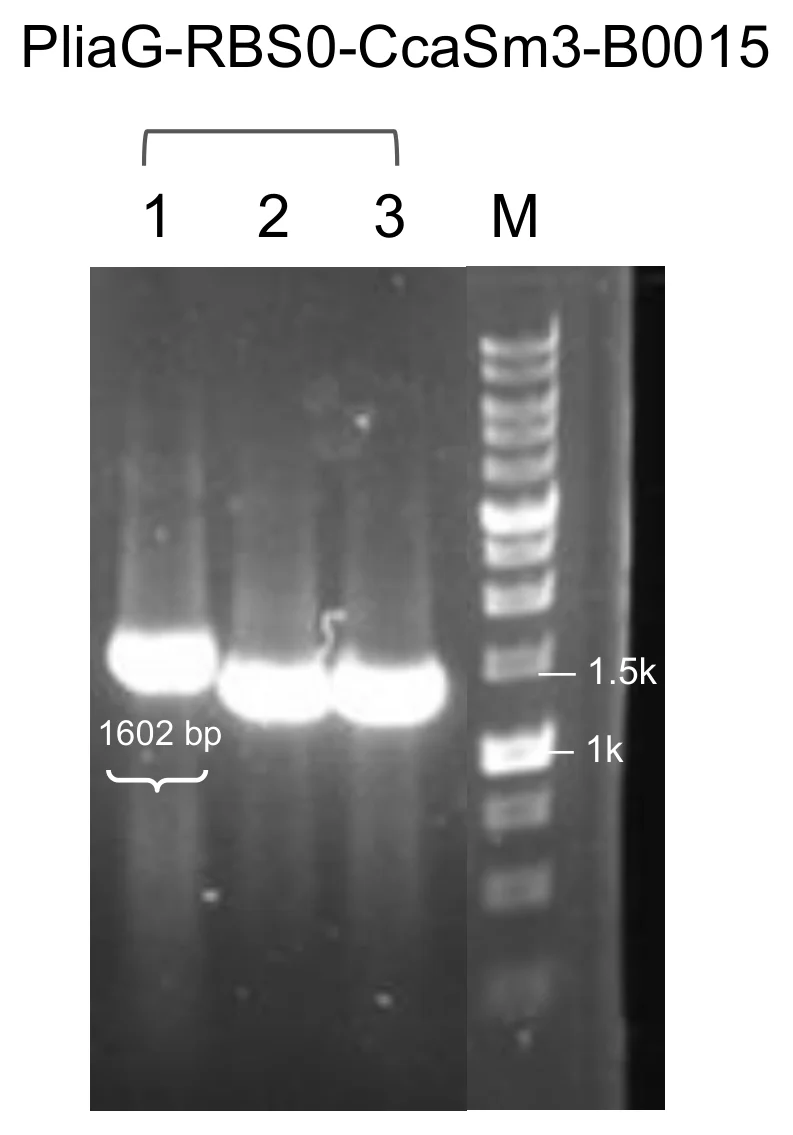
| Module 2 · PliaG–RBS0–ccaS-m3–B0015 | ✓1 of 3 | 1,602 bp | – | ✓that clone |
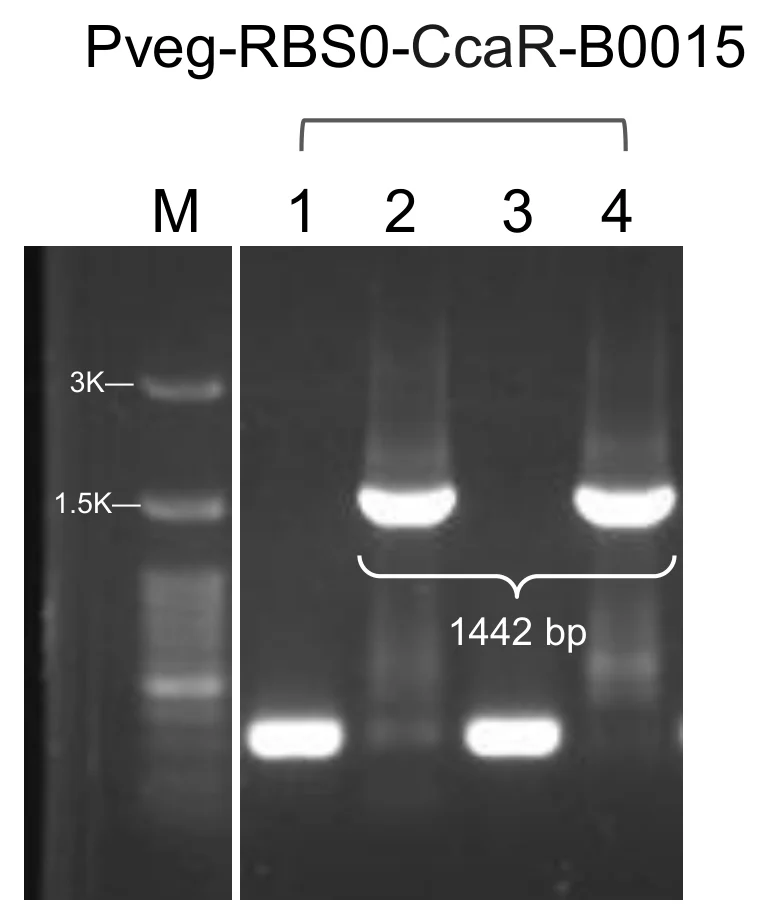
| Module 3 · Pveg–RBS0–ccaR–B0015 | ✓2 of 4 | 1,442 bp | – | ✓clone 2 |
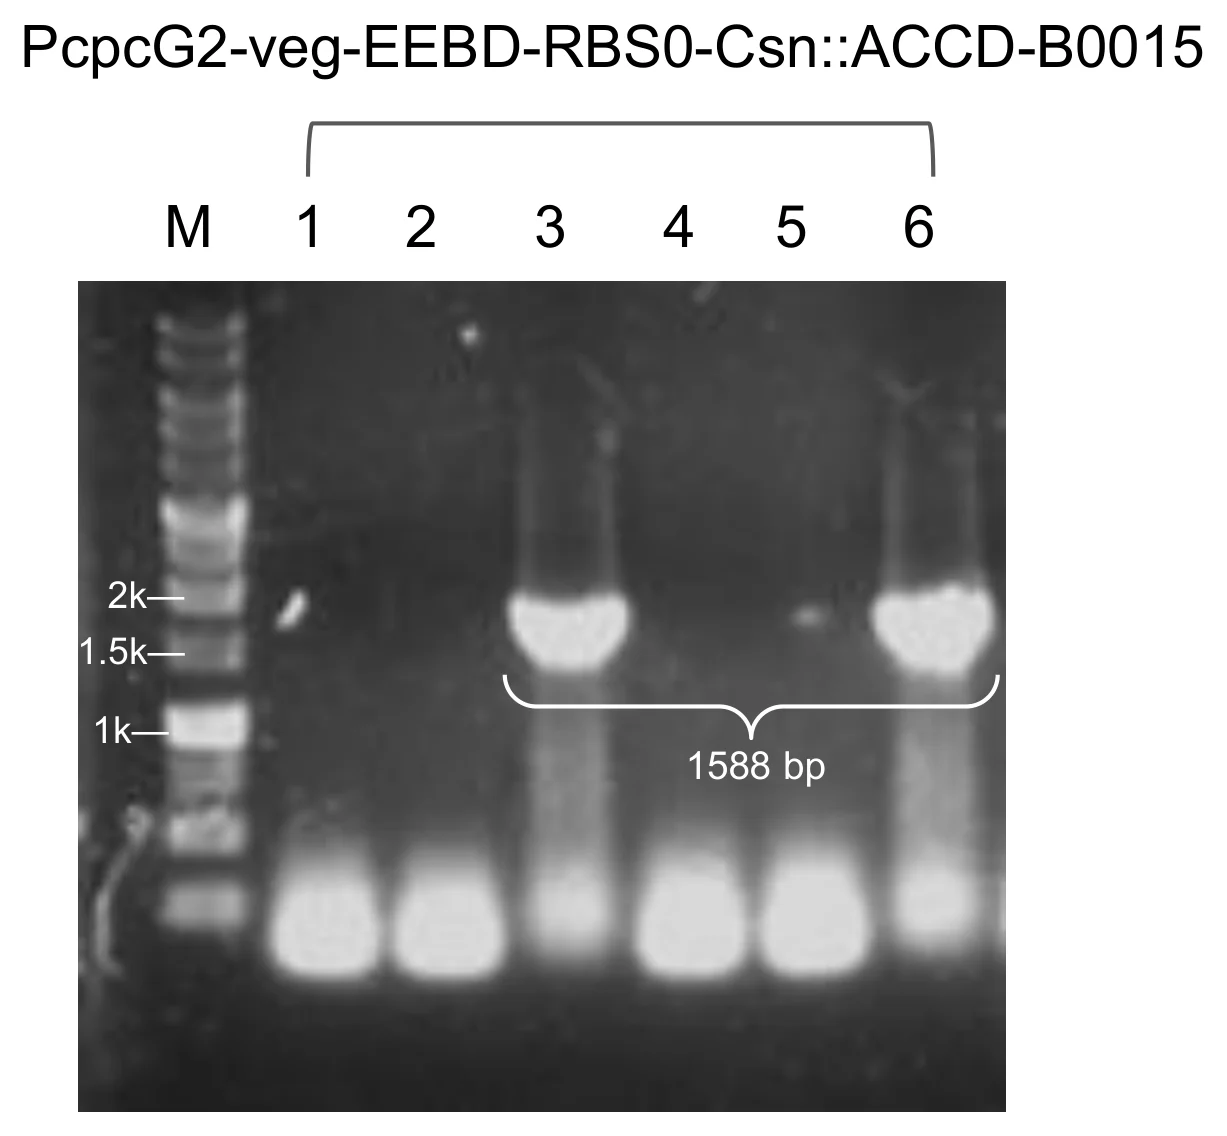
| Module 4 · Csn–AcdS | ✓2 of 6 | 1,588 bp | – | ✓clone 3 |
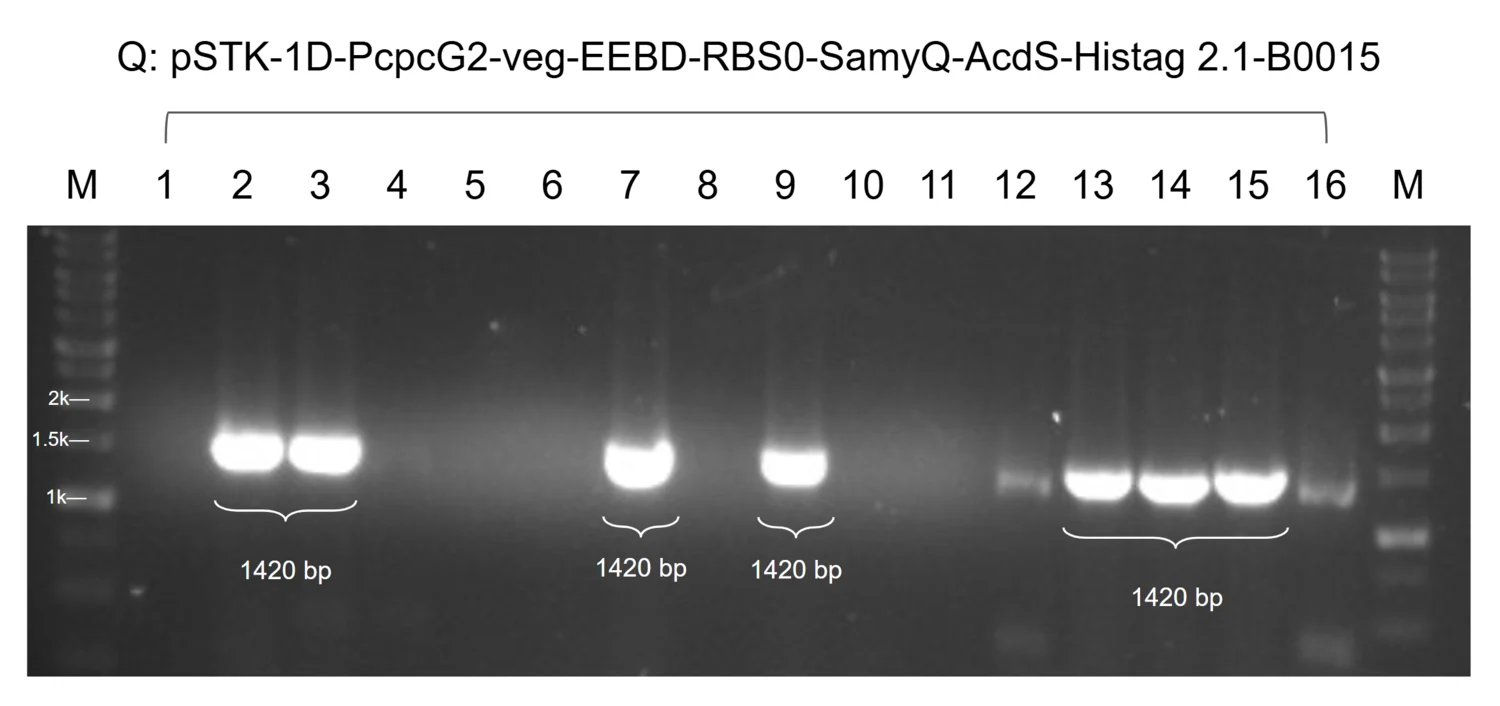
| Module 4 · SamyQ–AcdS 2.1 | ✓7 of 16 | 1,420 bp | – | ✓clone 2 |
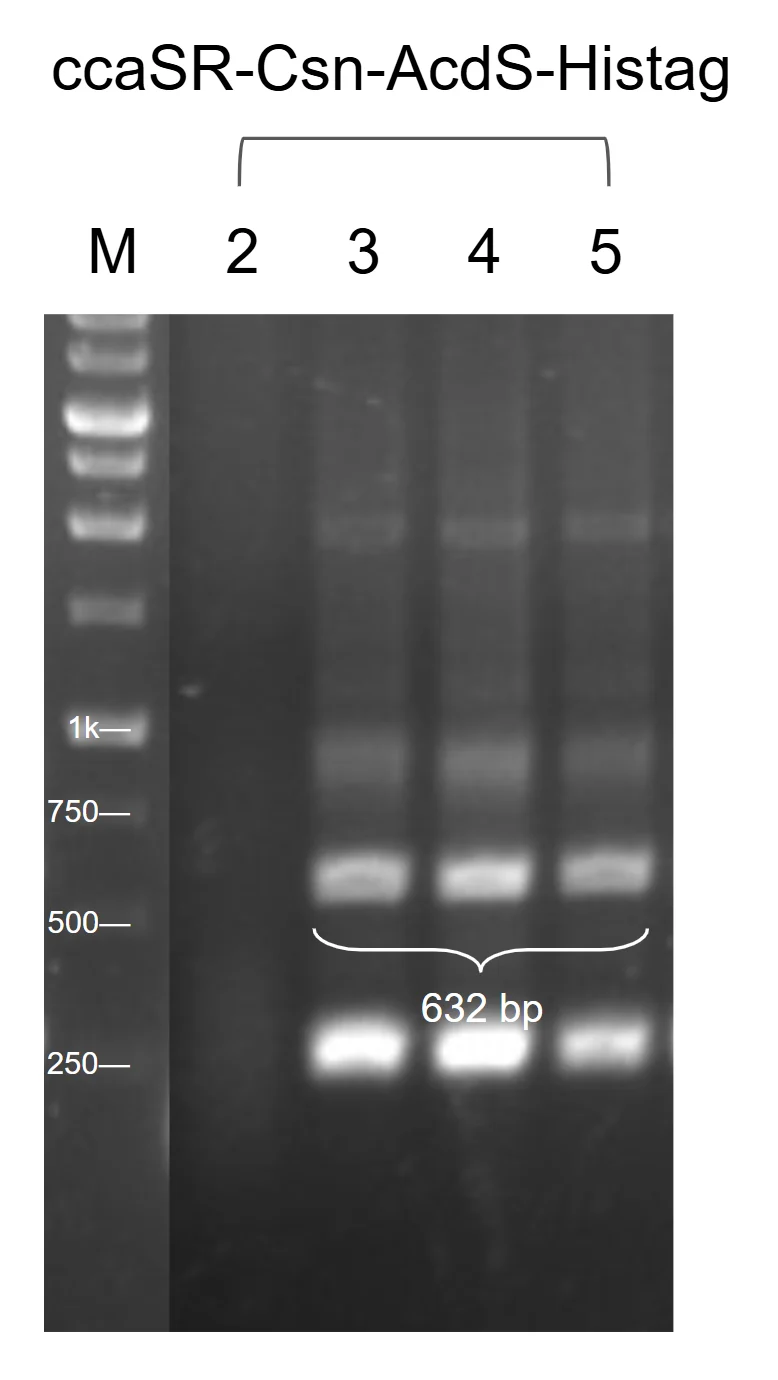
| ccaSR–Csn–AcdS–Histag | ✓3 of 3 | 632 bp | ✓2 of 2, all junctions | ✓clone 2 |
| ccaSR–SamyQ–AcdS 2.1–Histag | ✓gel not on file | – | ✓3 of 3, all junctions | ✓clone 1 |
| Pveg · Csn–AcdS | ✓on the gel | – | – | ✓ |
| Pveg · SamyQ–AcdS 2.1 | ✓4 of 8 | 1,984 bp | – | ✓clone 2 |
| Pveg · Csn–LEA14 | ✓1 colony | 735 bp | – | ✓that clone |
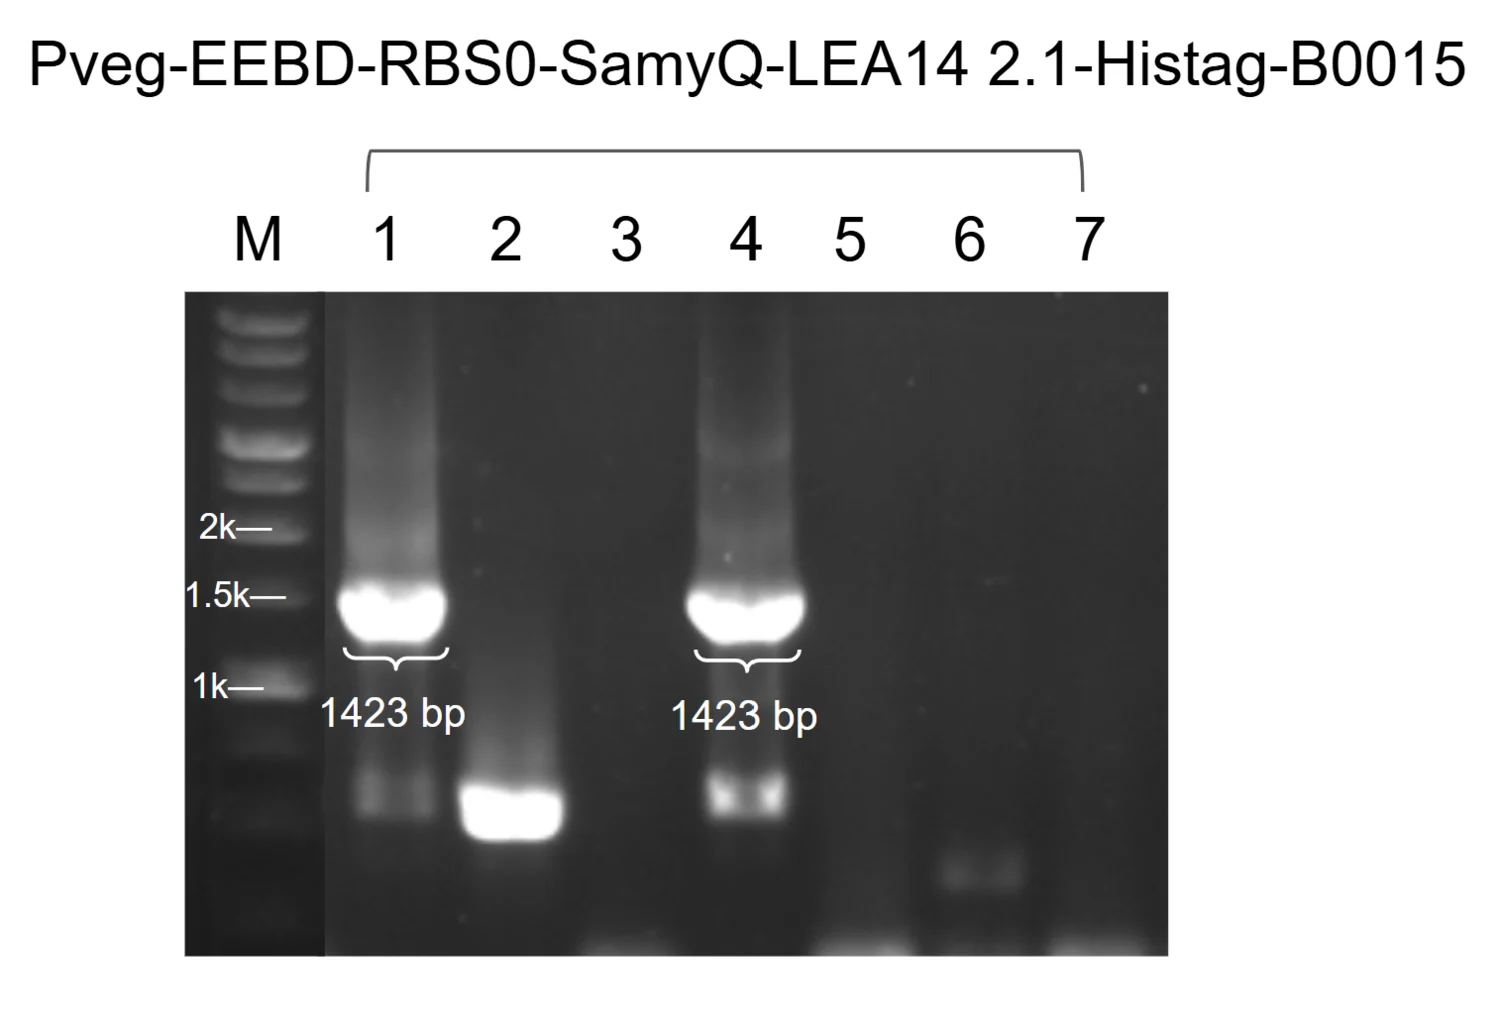
| Pveg · SamyQ–LEA14 2.1 | ✓2 of 7 | 1,423 bp | – | ✓clone 1 |
| Pveg · SamyQ–BoPep4 | ✓gel not on file | – | – | – |
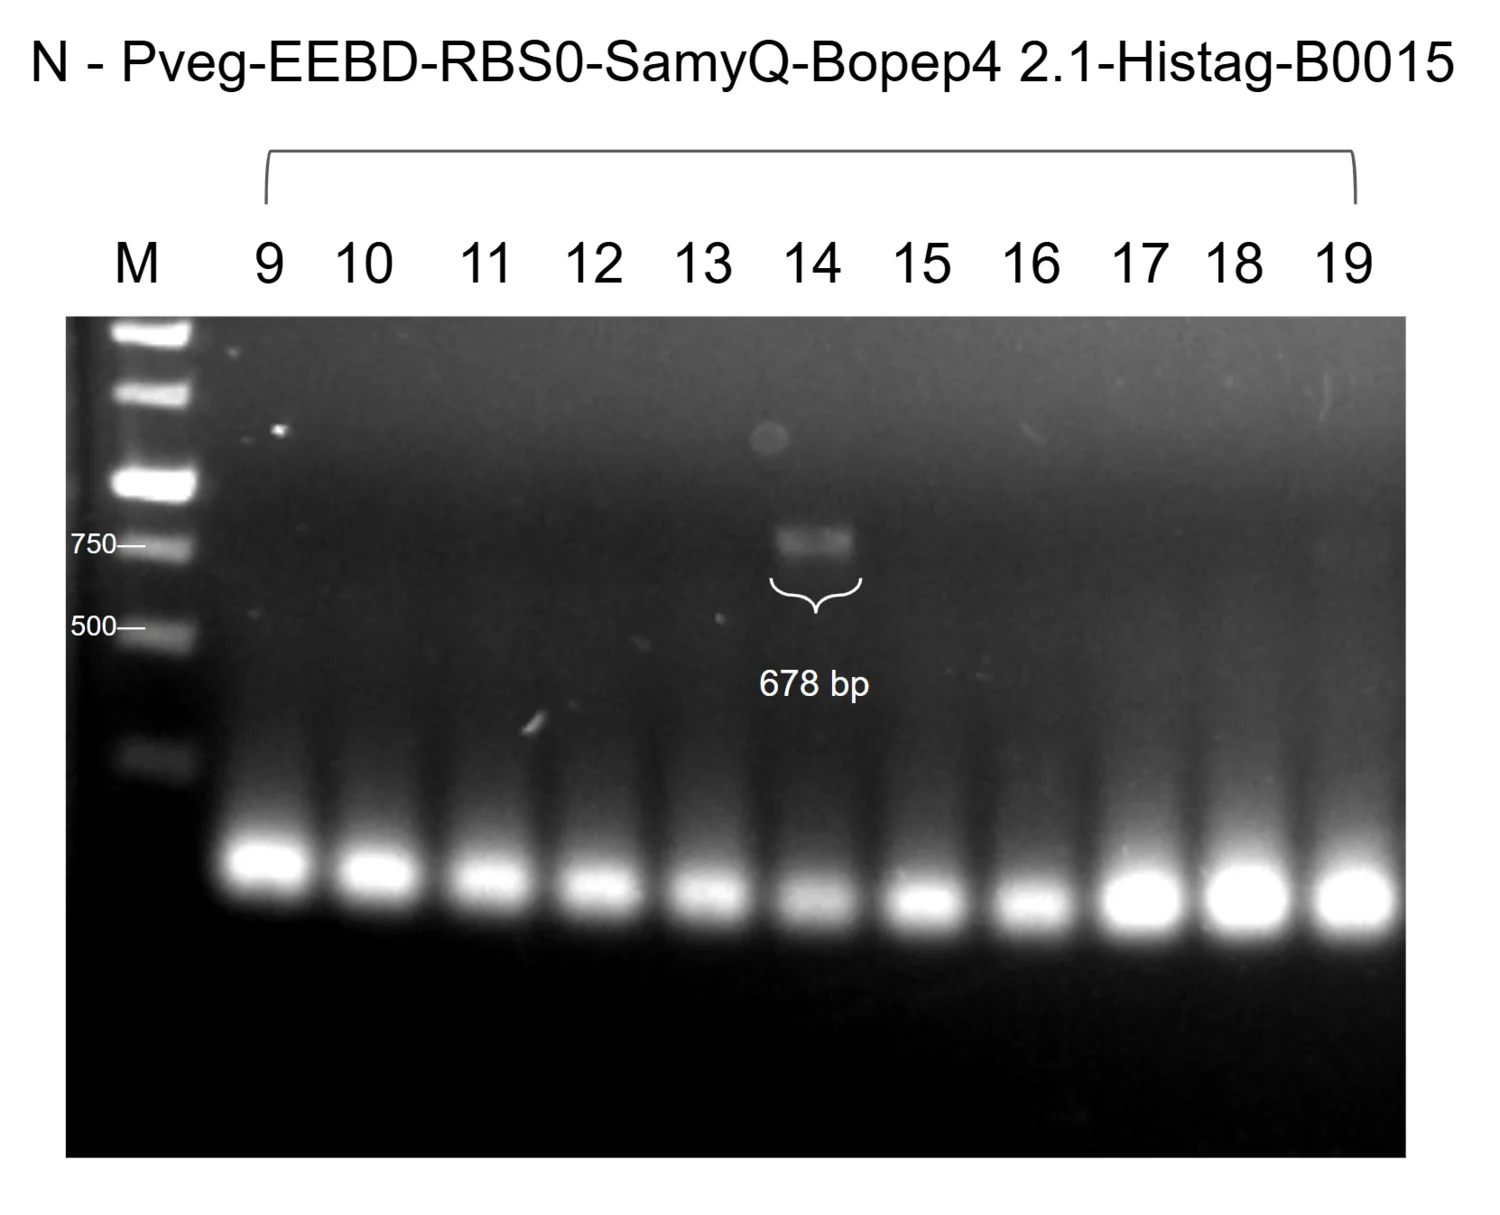
| Pveg · SamyQ–BoPep4 2.1 | ✓1 of 11 | 678 bp | – | ✓clone 14 |
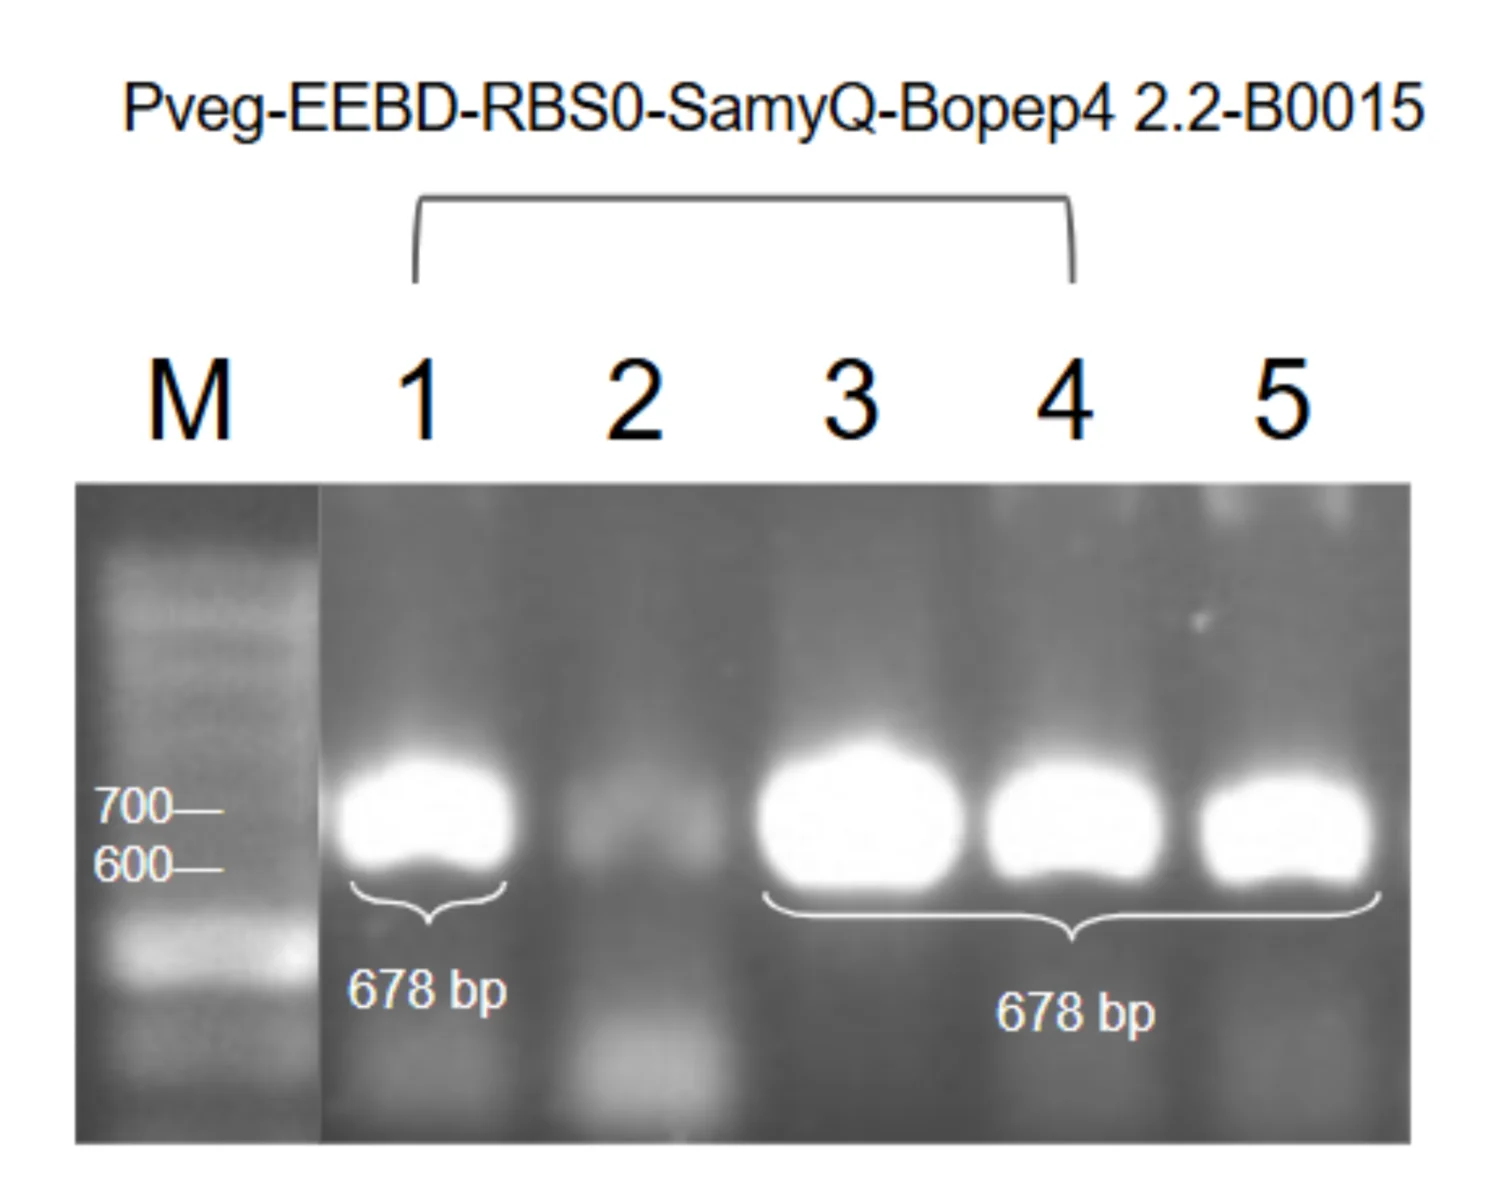
| Pveg · SamyQ–BoPep4 2.2 | ✓4 of 5 | 678 bp | – | ✓clone 5 |
| Pveg · SamyQ–BoPep4 15–23 | ✓gel not on file | – | – | – |
Three additional constructs were successfully assembled and verified by gel electrophoresis, but their gel images were not retained. These constructs are still included in our results, with the missing images noted. The available gel images are organized into four groups below.
The four modules
Colony PCR was used as a rapid initial screen to identify transformants carrying inserts of the expected size before further verification. After transformation, individual colonies were picked with a sterile tip, streaked onto an agar plate for later recovery, and the remaining cells were resuspended in 2× Q-amp master mix and sterile water. Primers flanking the cloning site were used, so colonies with the insert yield a band of the expected size while colonies carrying the empty vector yield a shorter product or none at all.
The products were separated by agarose gel electrophoresis and compared against a 3k or 10k bp DNA ladder. Colonies giving a band of the expected size were selected for overnight culture and plasmid extraction, followed by further verification to confirm the construct.
Complete systems
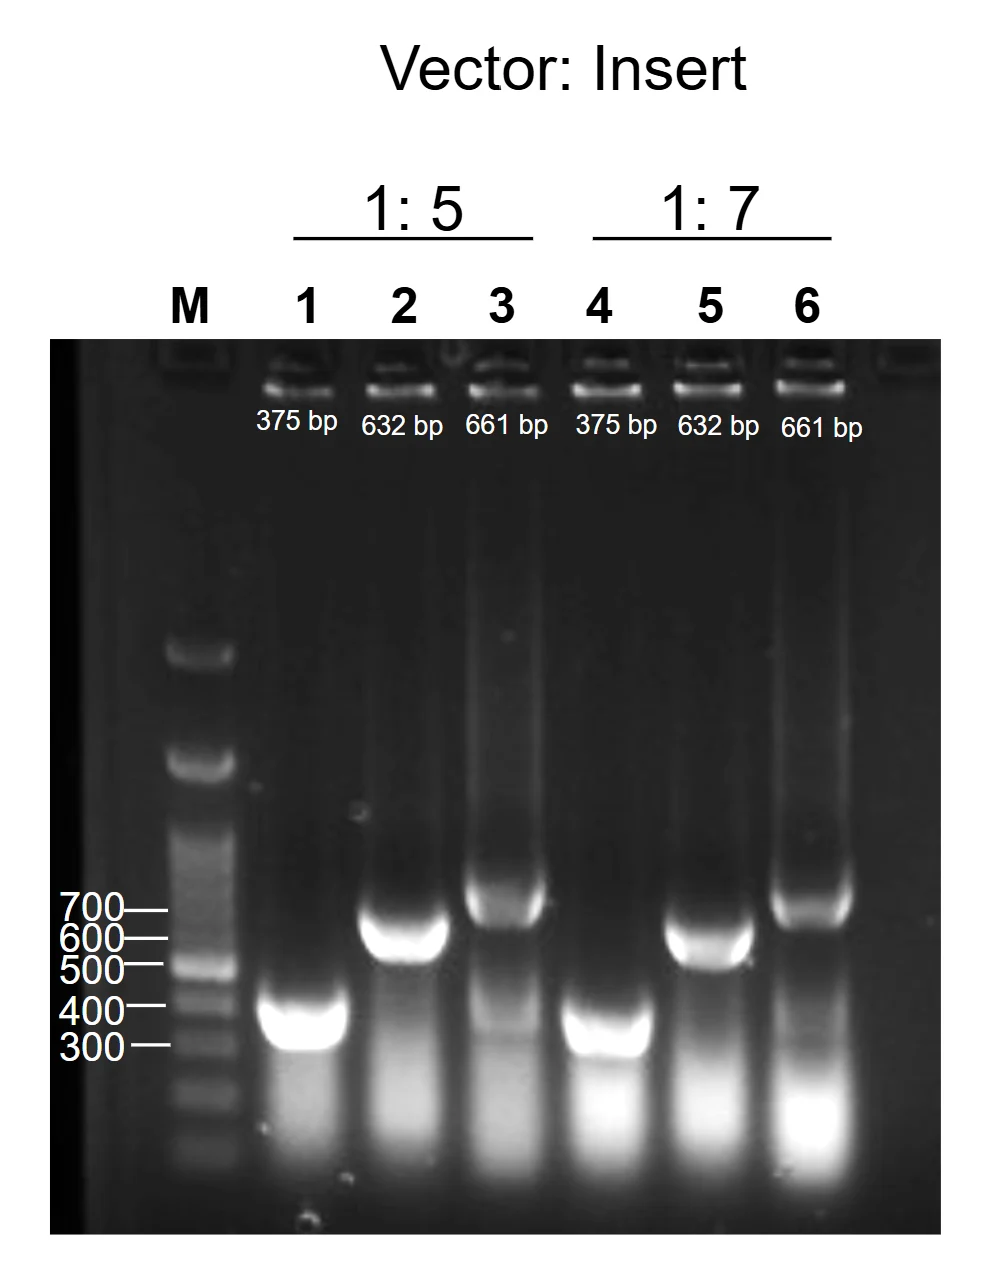
After colony PCR identified candidate clones, we grew the positive colonies in liquid culture overnight and purified their plasmids. For the two complete systems the purified plasmid was then used as template for a second round of PCR. Compared with colony PCR this step is more precise: a clean template gives more reliable amplification and fewer false positives, so band sizes can be interpreted with greater confidence.
Selected four-module constructs were then amplified using specific primers designed for cross-module verification. Each primer pair binds in one module and extends into the neighbouring one, so that it spans the junction between them: module 1 to 2, module 2 to 3, and module 3 to 4. A product of the expected size is obtained only if the two modules are joined directly, so these reactions confirm both that the intended DNA fragments are present and that the modules were assembled correctly and in the right order.
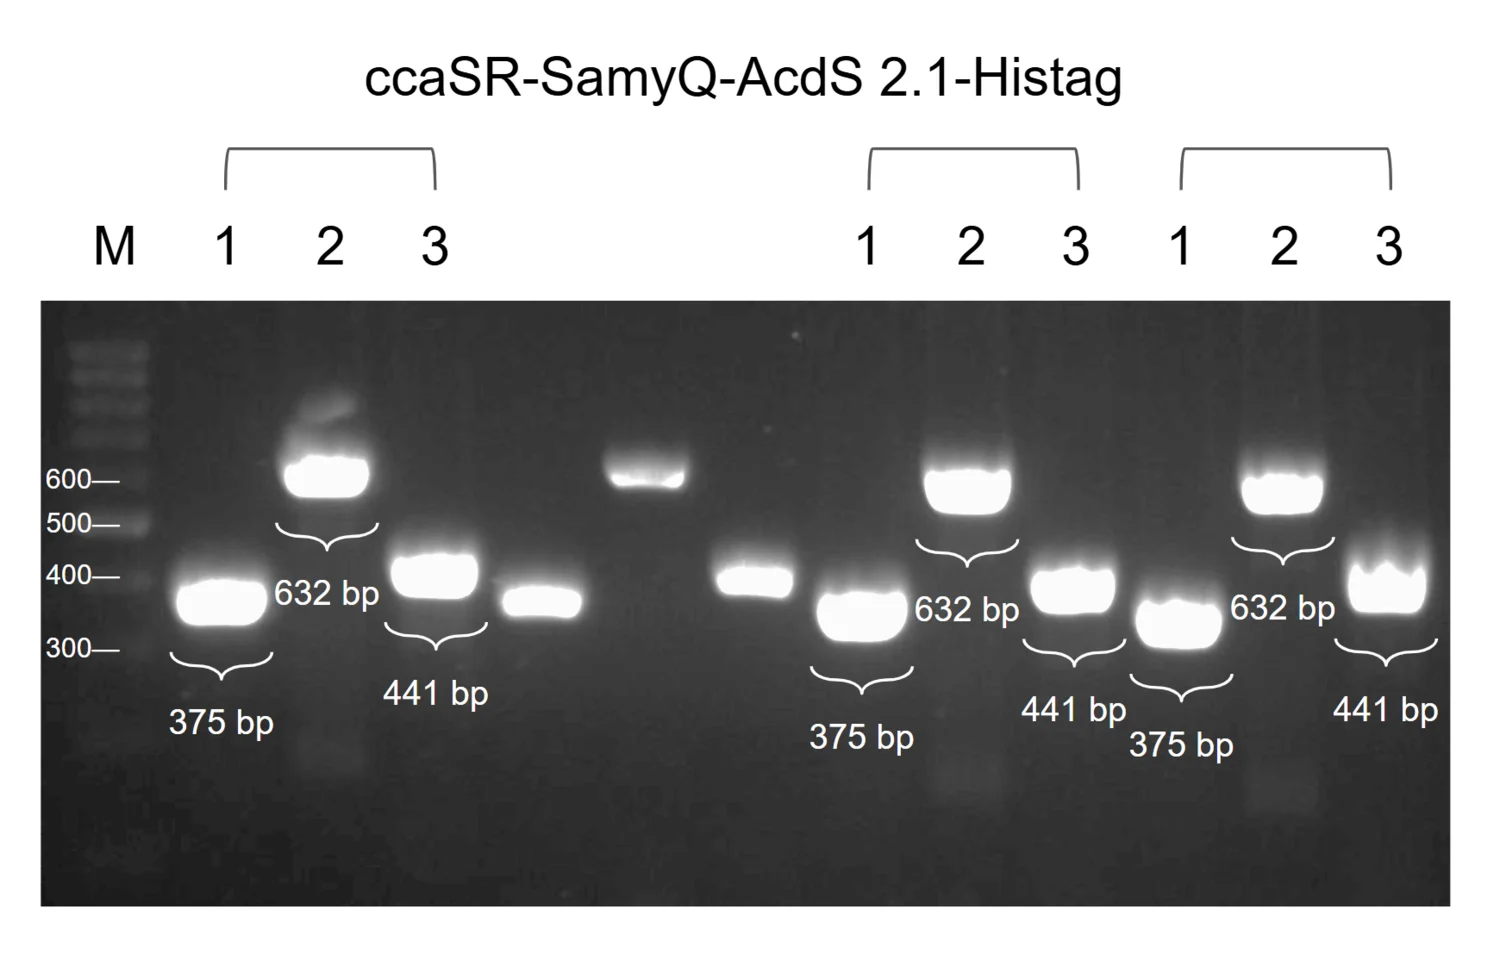
Together, colony PCR, cross-module PCR and sequencing provided multiple levels of evidence that the genetic constructs were assembled as intended before being introduced into downstream expression experiments.
Production cassettes
The production module drops the light switch and expresses each protectant constitutively, so that maximal secretion and detection can be evaluated without waiting on the optogenetic circuit. Eight cassettes were built across three protectants: ACC deaminase, LEA14 and BoPep4, each with a Csn or SamyQ secretion peptide.
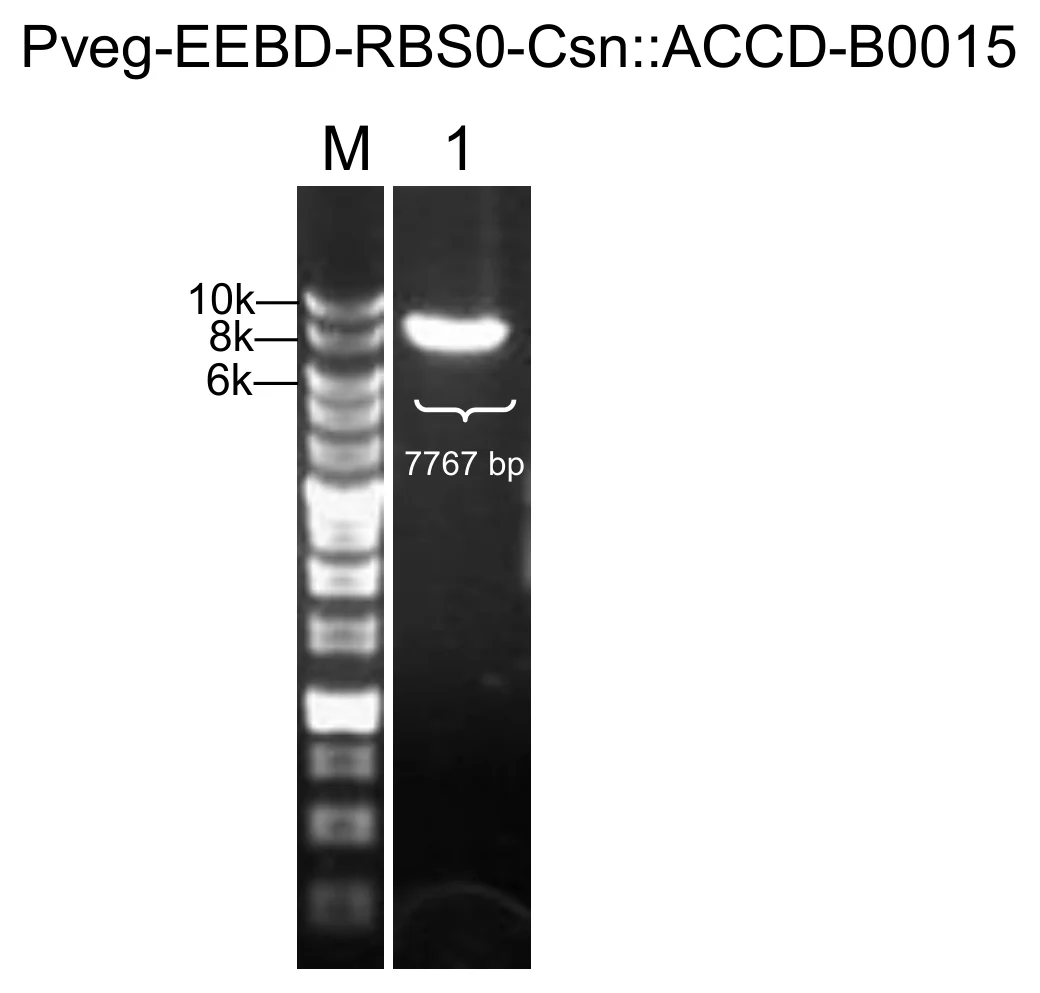
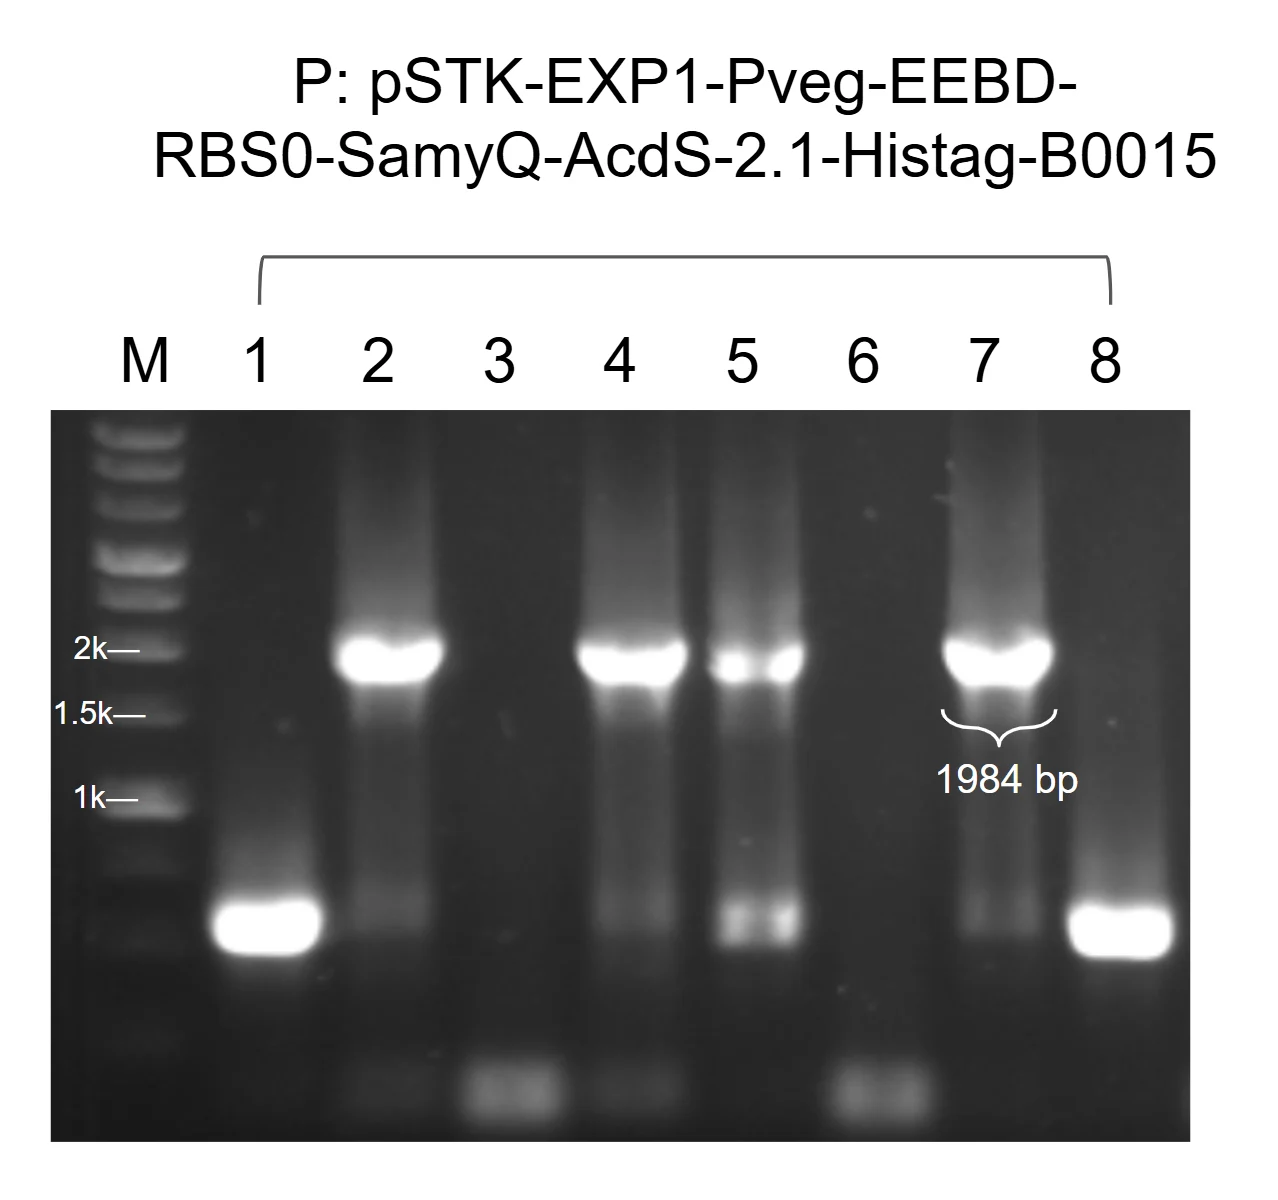
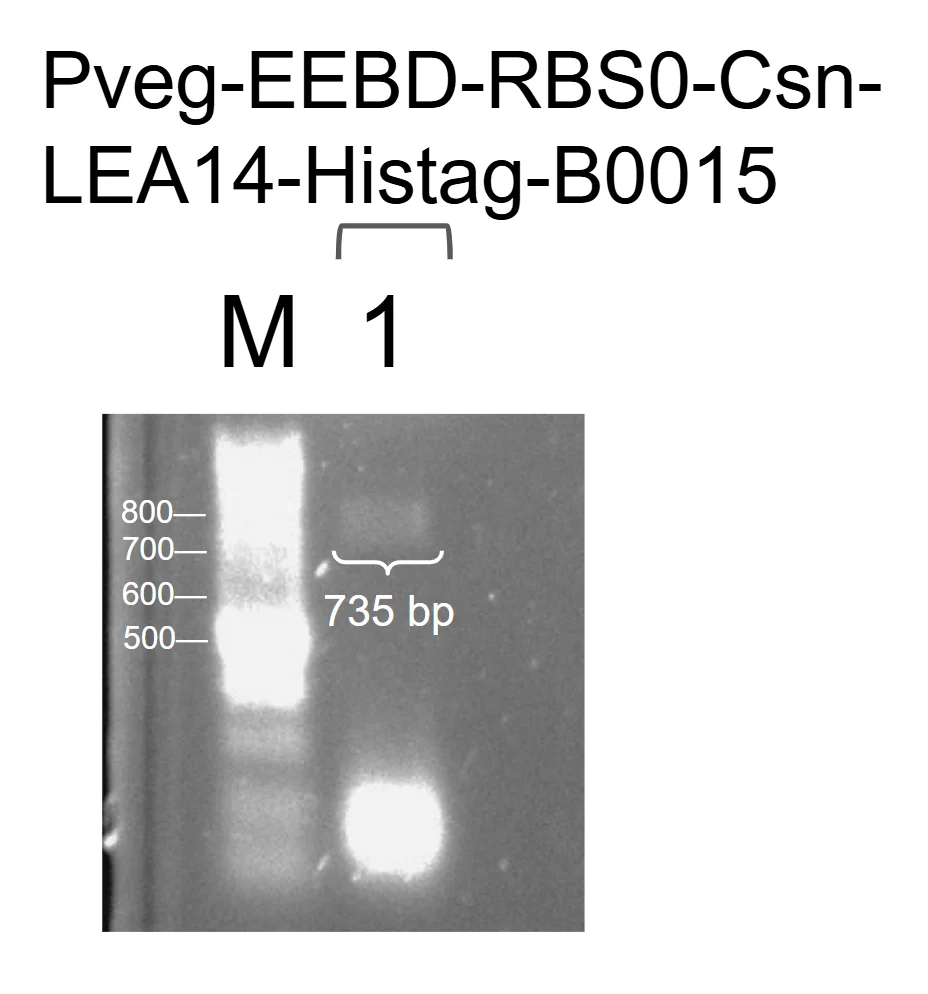
The gel images for Pveg–EEBD–RBS0–SamyQ–BoPep4–Histag–B0015 and for the 15–23 truncation are unavailable, but both constructs were successfully assembled and verified by gel electrophoresis.
Electroporation
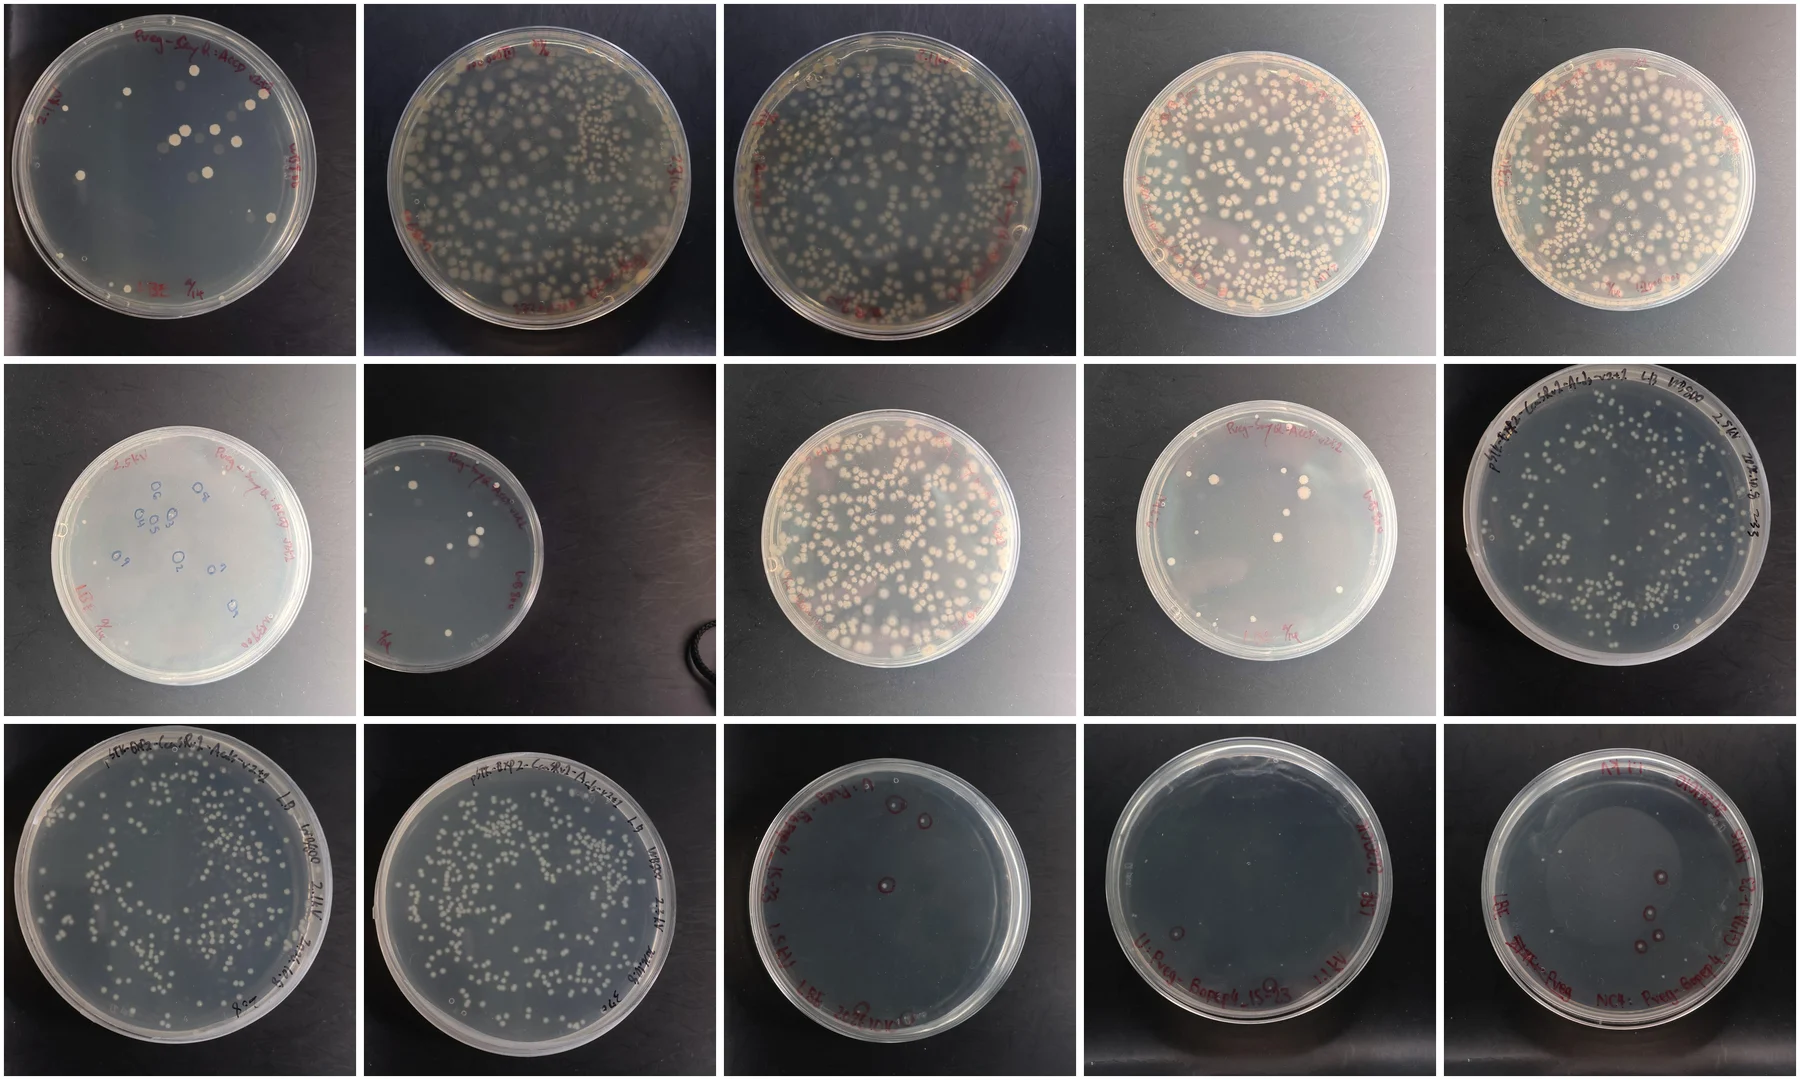
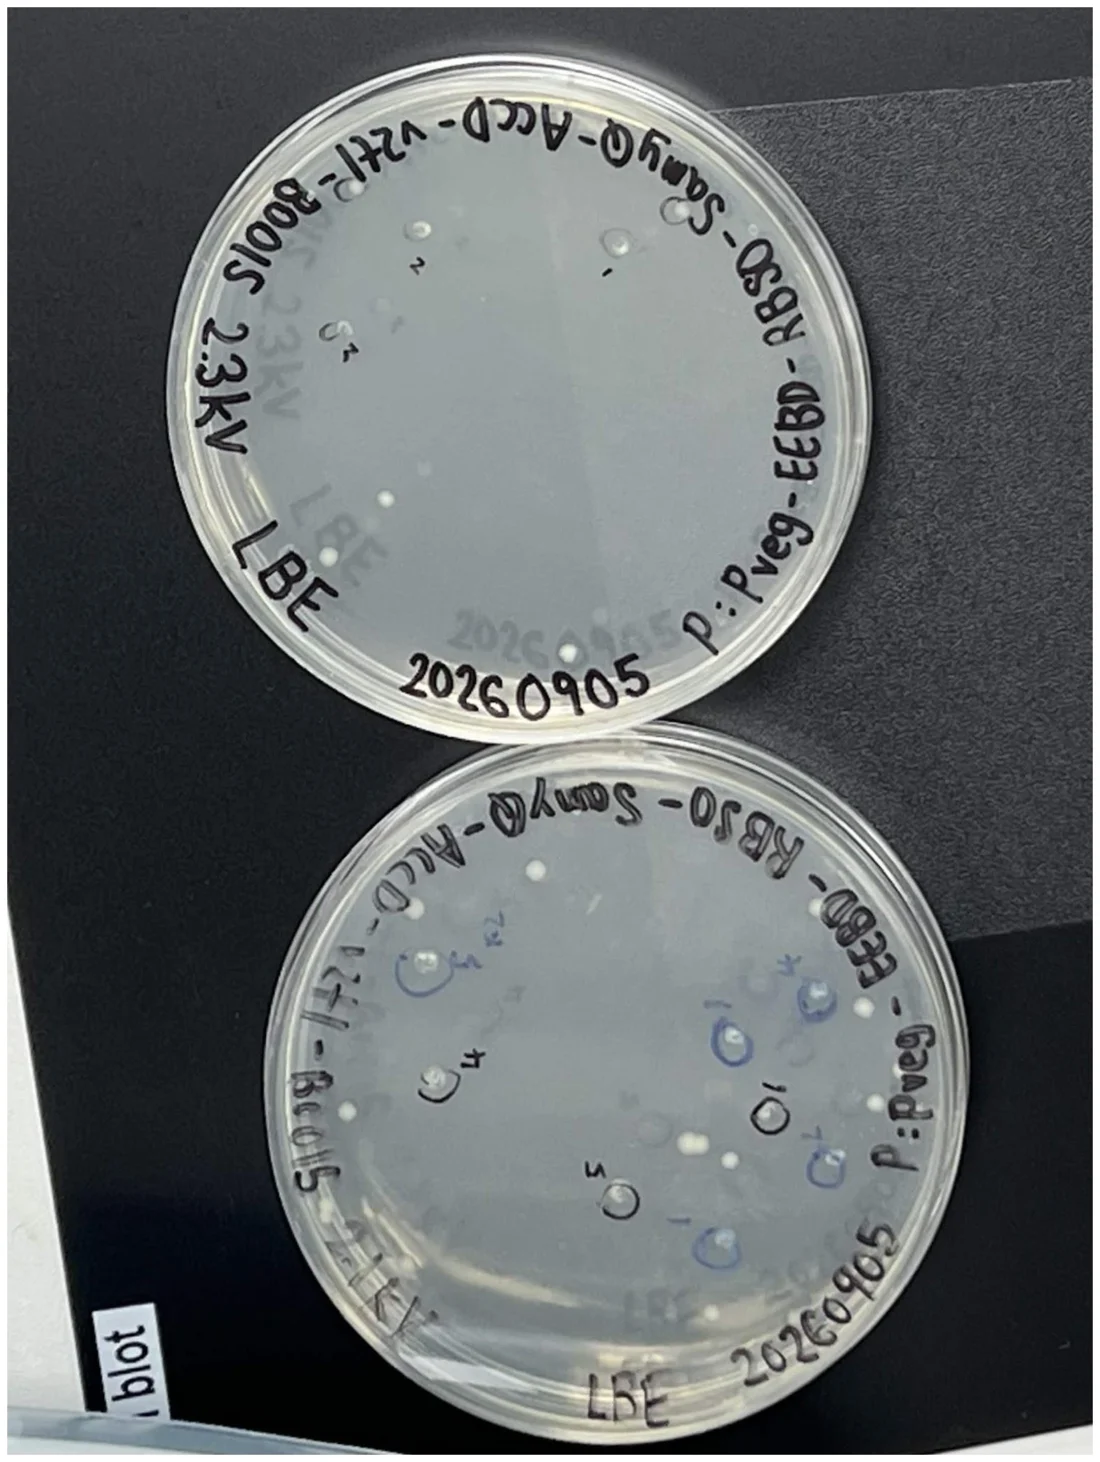
To identify transformation efficiency under various electroporation conditions, two B. subtilis strains, 168 and WB800, were evaluated at different field strengths. Cells were recovered after the pulse and plated on selective LB or LBE agar, and the colonies on each plate were counted.
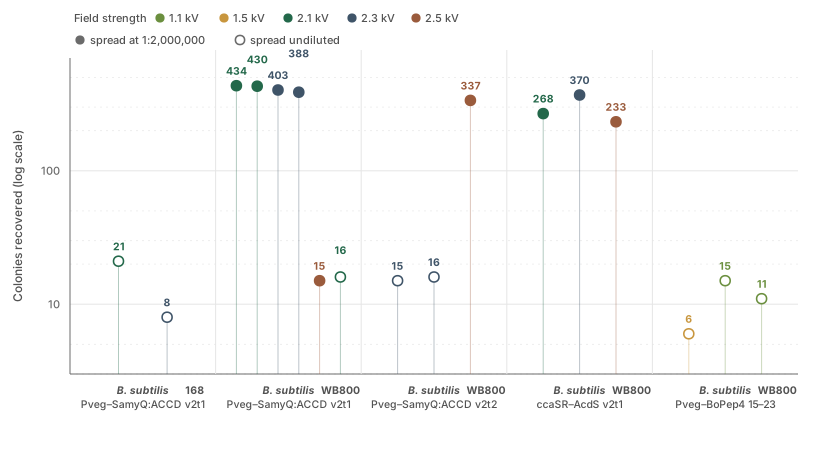
For B. subtilis 168 carrying Pveg–EEBD–RBS0–SamyQ–ACCD v2t1–B0015, 2.1 kV yielded 21 colonies against 8 at 2.3 kV, so recovery and viability were better at the lower field strength.
For B. subtilis WB800 carrying Pveg–SamyQ:ACCD v2t1, plating at a 1:2,000,000 dilution yielded high colony density at both 2.1 kV, 434 and 430 colonies, and 2.3 kV, 403 and 388. Increasing the voltage to 2.5 kV cut viability sharply to 15 colonies through excessive field strength and cell lysis, and plating at 2.1 kV without the dilution gave 16. On this evidence 2.1 kV is the optimal electroporation voltage for transforming WB800 with this construct.
The pattern is not the same for every construct. B. subtilis WB800 carrying pSTK–EXP2–CcaSR v1–AcdS v2t1 peaked at 2.3 kV with 370 colonies, against 268 at 2.1 kV and 233 at 2.5 kV, so 2.3 kV was taken as optimal there. For Pveg–BoPep4 15–23 the useful range was lower still: 1.5 kV yielded 6 colonies while 1.1 kV yielded 15, and the NC4 version of the same construct yielded 11 at 1.1 kV. Lower voltages appear to improve recovery and transformation yield for these constructs.
Protein expression
Three readouts sit behind the protein work, and each answers a different question. Western blot separates proteins by size, transfers them to a membrane and identifies them by antibody, so knowing our protectant's molecular weight we can tell whether the secreted components contain it. The DNPH assay uses 2,4-dinitrophenylhydrazine, which reacts with carbonyl groups to produce a brightly coloured derivative, and it gives us the enzyme activity of what our engineered B. subtilis secretes. ELISA captures the target on a microplate and detects it through an enzyme-conjugated antibody, and the signal is proportional to the amount present, so it reports a concentration against a standard curve.
The construct we focus on is ACC deaminase, because it carries the result of our codon optimisation. For the comparison we have two constructs that differ in both the secretory signal peptide, CSN against SamyQ, and the ACC deaminase gene sequence, wild type against codon-optimised v2t1. We quantify ACC deaminase in culture supernatants by anti-His ELISA to compare the expression and secretion of the two gene sequences.
The variance in signal peptide does influence the measured result, and due to time constraints we were unable to remove it with new cloning. To isolate the effect of codon optimisation, the signal peptide contribution is accounted for using published quantitative data. Documented values are limited and come from different studies: the native CSN signal peptide mediated 33.8% secretion of its cognate cargo in an E. coli system [9], and reached near 72% of the best signal peptide within a 173-member B. subtilis library for cutinase [10], while SamyQ has been reported to reach around 90% secretion of a heterologous α-amylase in B. subtilis [11]. With no direct comparison between the two peptides on ACC deaminase, the codon optimisation effect will be presented as a range, with a correction factor of 2.66 between the two peptides.
The ELISA has since been read against a fitted standard curve, and the supernatant concentrations are calculated. Across the two October bioreactor runs ACC deaminase is present from the first hour and holds between 3.4 and 6.5 µg/mL, the run whose pH was corrected automatically and the run corrected by hand averaging 5.0 and 5.1 µg/mL. Light-plate cultures of the codon-optimised construct were read on the same plate: 12.9 µg/mL under green light against 11.8 µg/mL under red at 13 h, and 12.5 against 12.1 µg/mL at 16 h.
What the assay does not give is the comparison this section was built around. No CSN construct was assayed beside the codon-optimised v2t1, so the fold difference between the two gene sequences cannot be calculated and the correction factor above has nothing yet to correct. Until one run carries both constructs, this section stands on the experimental design, that correction factor, and the evidence of successful secretion from the fractionation Western blot in section 7, where ACC deaminase was detected in the supernatant but not in either pellet sample. The concentrations are also protein and not activity: they say how much ACC deaminase is present, not how much of it turns over.
The chromoprotein reporter
AmilCP was undertaken as a stand-in reporter to quantifiably visualise the successful secretion of a desired construct from our engineered B. subtilis under our light plate apparatus and bioreactor. With chromoproteins we are able to use absorbance, since AmilCP gives a blue-purple hue, which is a quantifiable and relatively direct route compared with biochemical and protein expression assays. Enzymatic assays such as DNPH required substrates, some of which are explosive and dangerous to work with, on top of extra data and resources. Fluorescence-based reporters were not possible as we lacked the materials. Western blot is only semi-quantitative, indicating protein levels rather than numerical protein quantity, and ELISA, though quantitative, is set at a high price point for a single reaction, which was not feasible for our sample numbers.
Despite repeated experiments, and alongside the successful production of the construct within the bioreactor culture, the medium showed no purple colour. Spectrophotometric measurement of the supernatant after centrifugation also showed no absorbance peak at the expected wavelength, so no usable data could be obtained.
The unsuccessful result may be explained by the secretion mechanism of B. subtilis. Secreted proteins cross the cell membrane in an unfolded state and must fold outside the cell. However, AmilCP requires rapid folding of its beta-barrel structure to stabilise its chromophore, making it potentially unsuitable as a secretion reporter. Based on this result, we shifted our focus to ACC deaminase and the DNPH assay to evaluate enzyme activity.
Continuous culture monitoring
Can the inline photometer continuously monitor changes in culture density?
To monitor culture growth without repeatedly removing samples from the bioreactor, we developed an inline dual-beam photometer and evaluated its performance through long-term monitoring and independent turbidity calibration.
Six runs
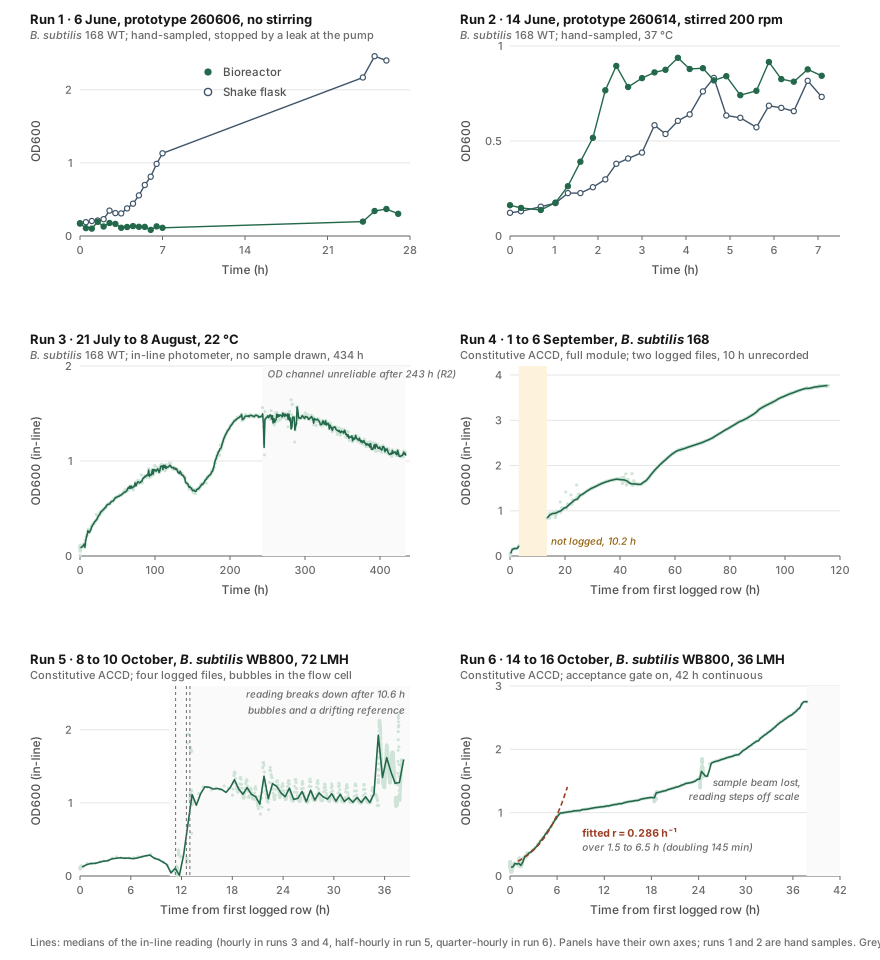
We conducted six bioreactor runs between June and October to evaluate the photometer's performance. Measurements from the first two runs were collected manually, while the remaining four used continuous inline monitoring without manual sampling. This section focuses on the photometer's performance across these runs, while the culture growth results are presented separately in section 7.
| Run | Measurement method | Data collected | Photometer results |
|---|---|---|---|
| 1 · 6 Jun | Manual sampling | 27 h | 0.17 to 0.37 in the loop against 2.46 in a flask; no inline channel yet |
| 2 · 14 Jun | Manual sampling every 15–20 min | 7.1 h | 0.90 by 145 min, flask 0.83 by 278 min |
| 3 · 21 Jul – 8 Aug | Inline monitoring every 10 min | 2,671 of 2,720 rows | 434.2 h unattended; the channel became unusable at 243.0 h |
| 4 · 1 – 6 Sep | Inline monitoring | 12,470 rows | 3.2 h to 0.24, then 10.2 h unlogged, then 102.4 h from 0.84 to 3.77 |
| 5 · 8 – 10 Oct | Inline monitoring | 37.5 of 38 h | 0.10 to 0.30 over nine hours, then nothing readable |
| 6 · 14 – 16 Oct | Inline monitoring with acceptance gate | 1,083 windows, 41.8 h | 0.14 to 2.71 by 37 h, 31 windows rejected, no restart |
Run 3 served as our endurance test, demonstrating the photometer's ability to monitor a culture continuously for over 18 days without manual sampling. Over 434.2 hours, the system recorded measurements every ten minutes, producing 2,671 valid readings out of 2,720. However, the reference beam began showing irregular fluctuations around 220 hours, and the optical density measurements became unreliable at 243.0 hours, with variability increasing five- to tenfold. This failure provided valuable data for developing the fault detection model described in section 2, which identified the issue at 216.3 hours, before the measurement channel became unusable.
Run 5 experienced a different type of failure. Although OD600 initially increased from 0.10 to 0.30 over nine hours, the readings subsequently declined despite continued culture growth. Approximately one-sixth of the measurement windows contained over 20% bubbles, while the reference signal varied by a factor of 4.8. As a result, measurements after 10.6 hours could no longer reliably represent culture growth.
To address these issues, we made two improvements for run 6: reducing the permeate flow rate from 24 to 12 mL/min and introducing an acceptance filter that retained the last valid reading when measurements failed quality checks. Of the 1,083 measurement windows, 31 were rejected, none exceeded 20% bubbles, and reference signal variation remained within 17%. These improvements produced a stable OD600 curve, increasing from 0.14 to 2.71 over 37 hours. Beyond approximately 2.7, the sample signal dropped to one-tenth of the reference, triggering a low-signal warning and indicating the instrument's upper measurement limit under these conditions.
However, two limitations remain. First, no simultaneous manual samples were collected to independently validate the inline measurements. Second, the photometer measures turbidity rather than cell concentration directly, meaning the recorded curves cannot be interpreted as exact cell counts without further calibration.
Calibration
To determine whether the photometer responded predictably to increasing turbidity, we calibrated it against two different particulate standards. Each provided a nonliving turbidity reference, allowing us to characterise the optical response independently of changes in microbial growth, and testing a second material allowed us to evaluate whether the relationship observed with the first was reproducible.
We first calibrated the photometer using titanium dioxide (TiO₂) in August, followed by silicon dioxide (SiO₂) to align with the iGEM interlaboratory protocol [5]. Both experiments involved gradually increasing particle concentrations in a continuously stirred loop and comparing the photometer readings with a BioDrop spectrophotometer at each concentration.
| Standard | Range | Points | Our R² | BioDrop R² | Our residual SD |
|---|---|---|---|---|---|
| TiO₂, 23 August | 2 to 60 mg in 400 mL | 45 paired | 0.987 | 0.991 | 0.024 OD |
| SiO₂, 10 October | 2.5 to 100 mg in 500 mL | 40 steps | 0.992 | 0.979 | 0.016 OD |
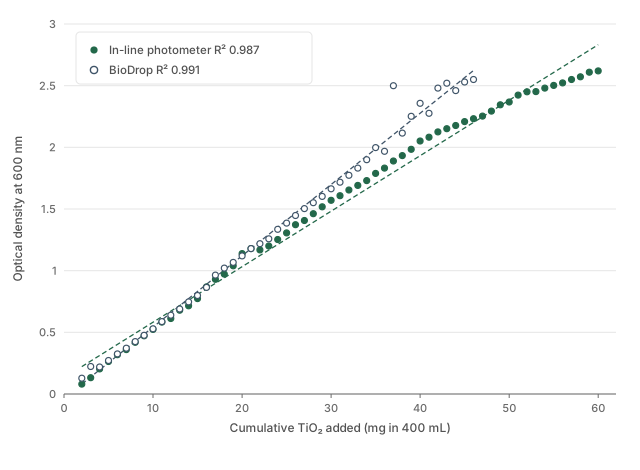
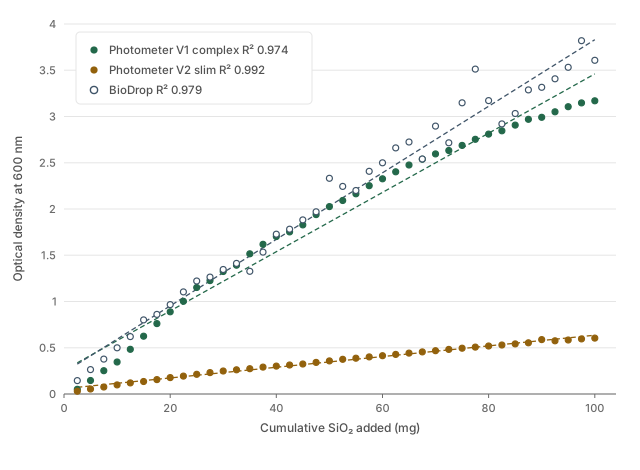
The inline photometer showed strong agreement with the BioDrop spectrophotometer in both calibration experiments. With titanium dioxide (TiO₂), it achieved a slope of 1.018 and an R² of 0.995 up to an OD600 of 1.2, with more stable readings than the BioDrop above approximately 30 mg. The silicon dioxide (SiO₂) experiment also showed a strong linear relationship (R² = 0.992), with only one-tenth of the reference instrument's residual variation. These results support the photometer's ability to produce consistent measurements across different materials, including with the updated prototype.
The SiO₂ experiment provided further evidence of measurement consistency through a dilution and recovery test at 137.6 minutes. The OD600 decreased from 2.3610 to 0.7943 after dilution, then returned to 2.3665 when the original concentration was restored. The dilution ratios were 2.97 and 2.98, and the final reading differed from the initial value by less than 0.2%. These results demonstrate that the photometer responded proportionally to changes in particle concentration and recovered its original reading when the concentration was restored, supporting its use for comparing measurements over time.
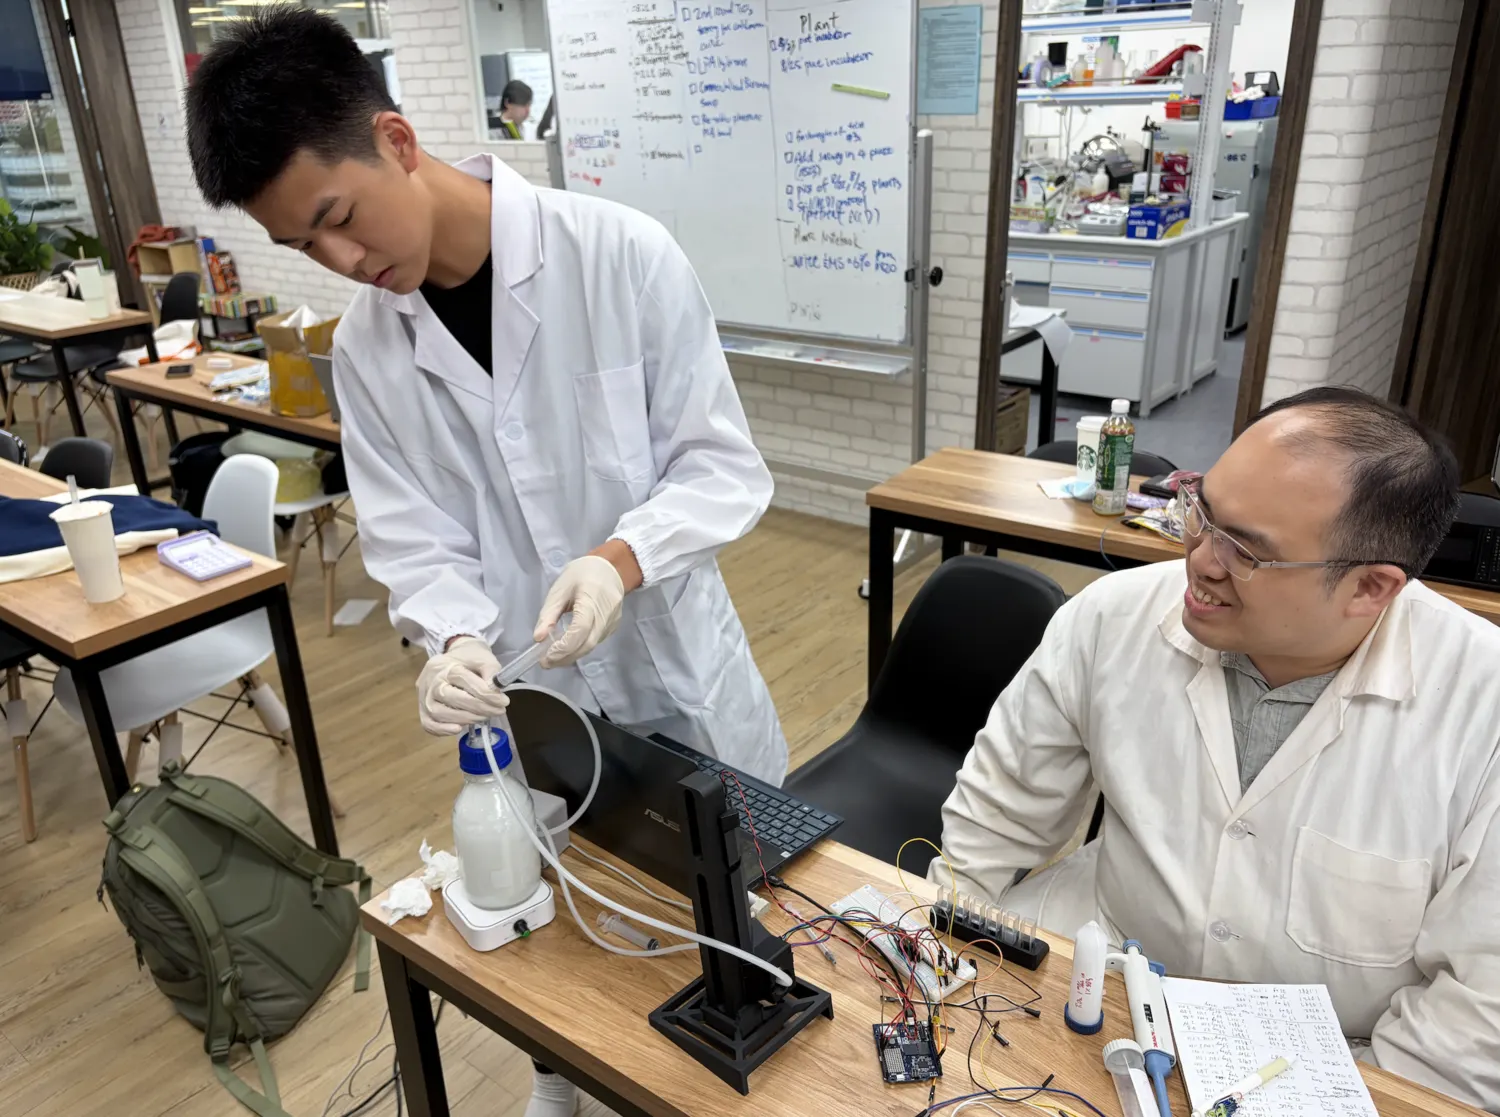
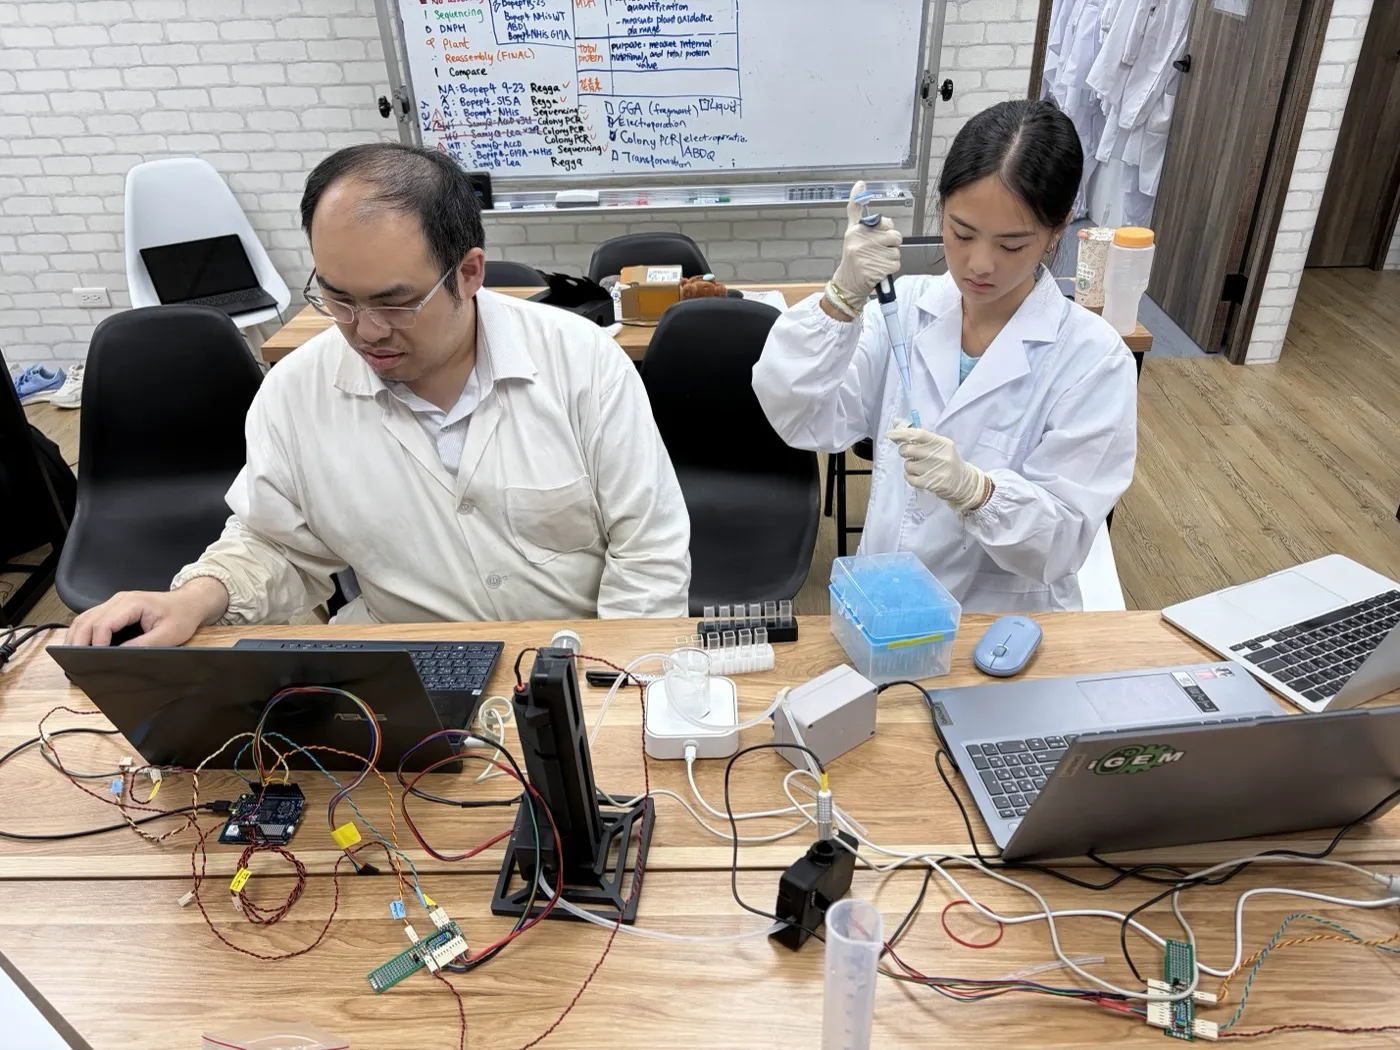
However, neither calibration directly measures cell concentration, as both experiments used nonliving particles. While the results confirm a linear relationship between particle concentration and turbidity, converting optical density measurements into cell counts would require additional calibration against plate counts, which we have not yet conducted.
Protectant function
Do our protectants actually improve plant stress response?
To determine whether the protectants actually benefit plants, we used Arabidopsis thaliana as our plant model. We compared plants under normal conditions, stress conditions, and stress conditions supplemented with protectant. Our plant-validation experiments were designed to move from highly controlled agar-based testing toward a hydroponic system that more closely reflects our intended application pathway.
We evaluated two plant protectants: ACC deaminase, the enzyme produced and secreted by our engineered bacteria, and CH bio peptide, a commercially available biostimulant used as a reference treatment. CH bio peptide served as a comparison for evaluating plant protection in our assays, and its results should not be interpreted as evidence of ACC deaminase effectiveness.
Salinity on agar
We first evaluated protectant performance under controlled salt stress. The general framework crossed salt against protectant in four conditions: neither, salt alone, protectant alone, and both. Depending on the trial, different salt concentrations and protectant timings were evaluated. By comparing salt-stressed plants with and without protectant treatment, we could determine whether the protectant reduced the negative effects of salinity on plant growth.
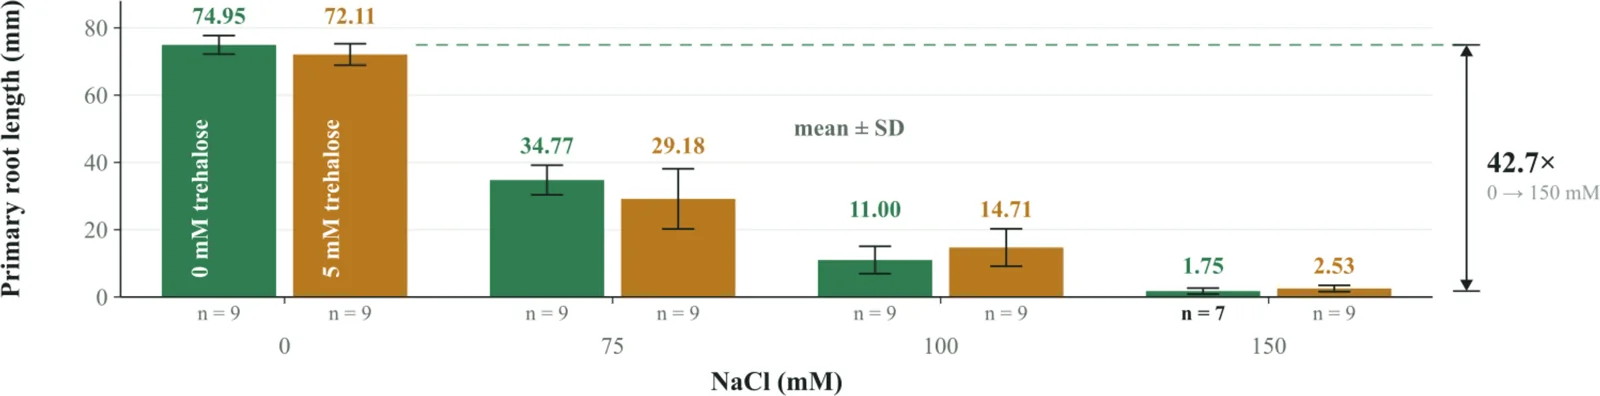
Before testing the protectants, we first confirmed that salt stress inhibited plant growth. After six days, the average primary root lengths were 74.95, 34.77, 11.00 and 1.36 mm at 0, 75, 100 and 150 mM NaCl respectively, with nine seedlings per group and no overlap between the groups' measurement ranges. These results demonstrate a clear dose-dependent reduction in root growth, providing a baseline for evaluating the effectiveness of subsequent protectant treatments.
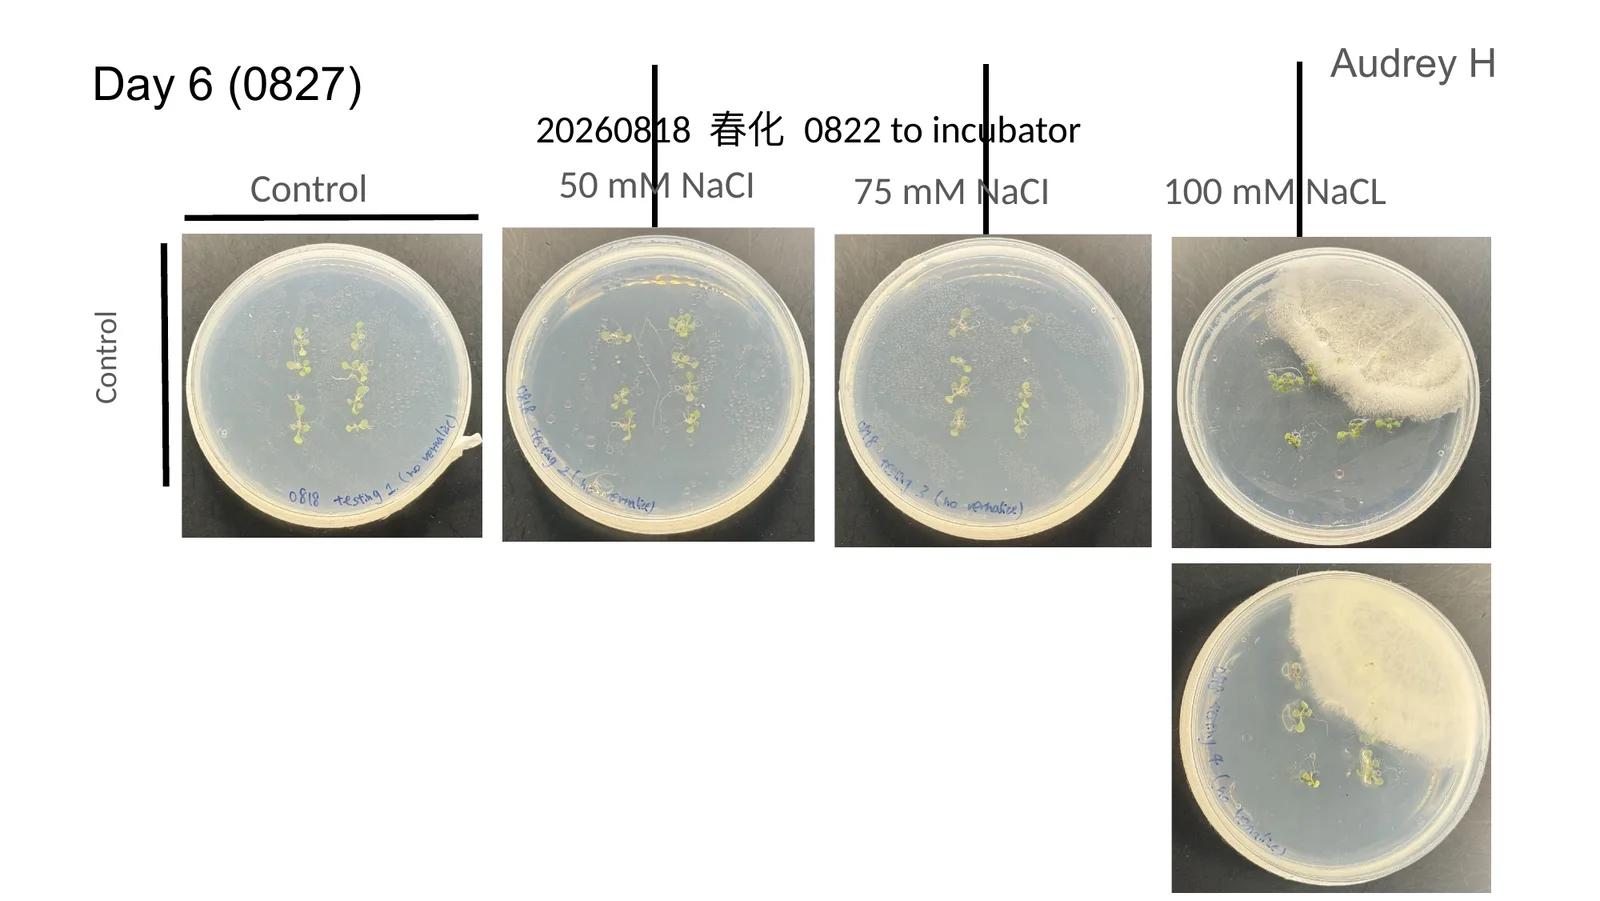
We then tested ACC deaminase at three different treatment timings under salt stress. This was the only experiment in which a protectant-treated group showed better plant growth measurements than its corresponding untreated control.
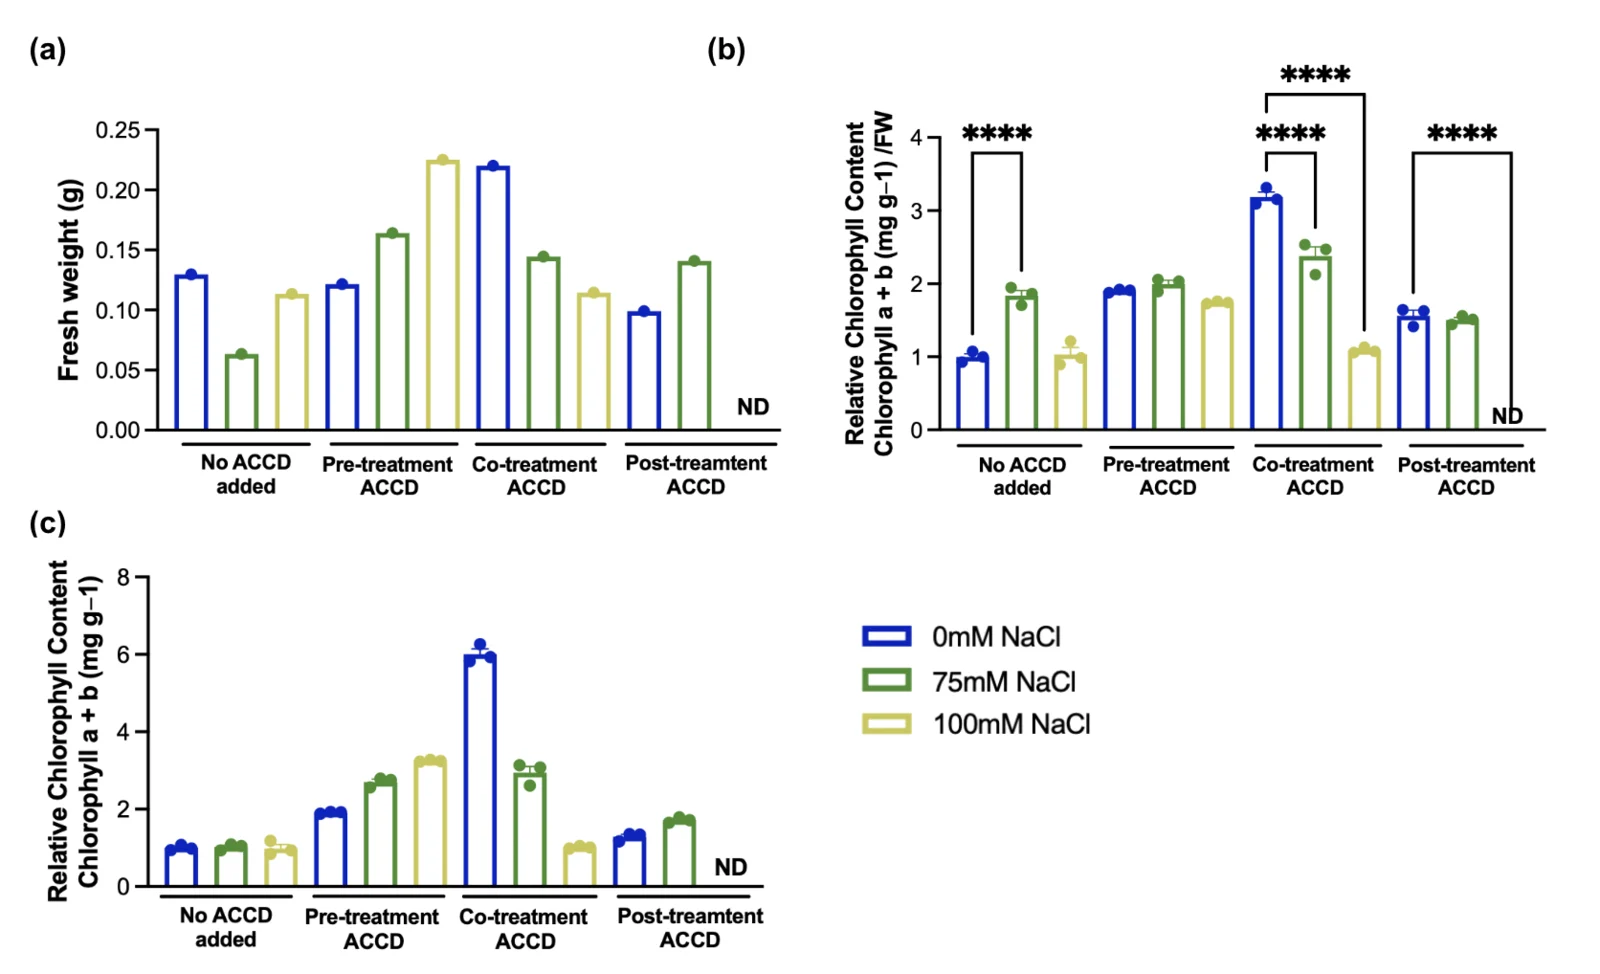
ACC deaminase treatment generally resulted in higher chlorophyll levels than the untreated controls at the same salt concentration, although the effectiveness varied with treatment timing. After normalising chlorophyll content to fresh weight, panel (b), co-treatment showed the greatest improvement under no salt stress, 3.2 compared with 1.0 in the control, and at 75 mM NaCl, 2.4 compared with 1.85. However, this benefit disappeared at 100 mM NaCl. Pre-treatment produced more consistent results, maintaining higher chlorophyll levels than the control across all three salt concentrations. In panel (c), pre-treatment was also the only group whose relative chlorophyll content increased with salt concentration, reaching 3.3 times the control.
However, these findings have several limitations. First, the statistical significance markers indicate differences between salt concentrations within each treatment group, rather than differences between treated and untreated plants. Therefore, they do not establish that ACC deaminase significantly improved plant performance. Second, the experiment included only three replicates per group and was not independently repeated. Finally, the 100 mM post-treatment result was unavailable, preventing a complete comparison of treatment timings under the highest salt concentration.
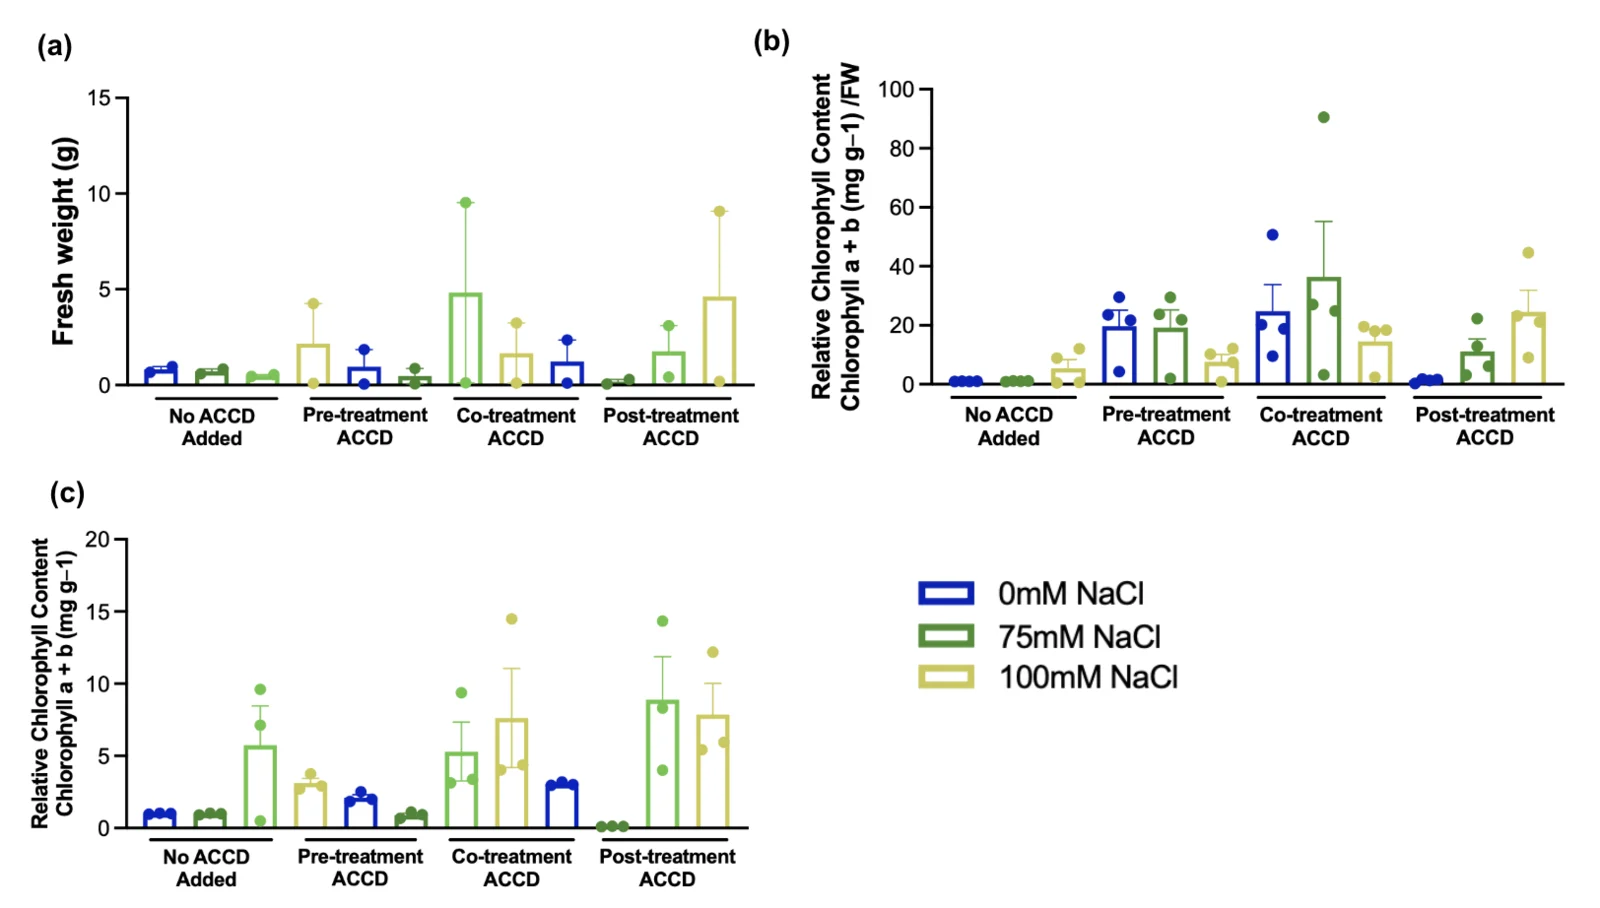
The second experiment showed a similar trend, with all ACC deaminase treatment groups having higher chlorophyll levels than their untreated controls. However, the results varied considerably, with some individual measurements reaching four to ten times their group's average. This variability makes the findings unreliable for statistical comparison. Therefore, while the first experiment provides evidence that ACC deaminase may improve chlorophyll retention under salt stress, further experiments are needed to confirm its effectiveness and reproducibility.
Heat on agar
We next evaluated plant response under controlled heat stress. Plants were divided into control and heat-stressed groups, with and without protectant treatment, allowing us to determine whether the protectants improved heat tolerance or recovery.
Seven-day-old seedlings were transferred onto sterilised agar plates identified as the four experimental groups: no peptide added, pre-treatment, co-treatment and post-treatment. Pre-treatment peptide was applied immediately after transfer on the seventh day; co-treatment a day later, alongside placing all heat-stress groups into the heat chamber; after five days at 37 °C all plates were returned to the 22 °C growth chamber, and the post-treatment group received peptide at that point. This interval design allowed the groups to separate on growth parameters under the imposed heat stress.
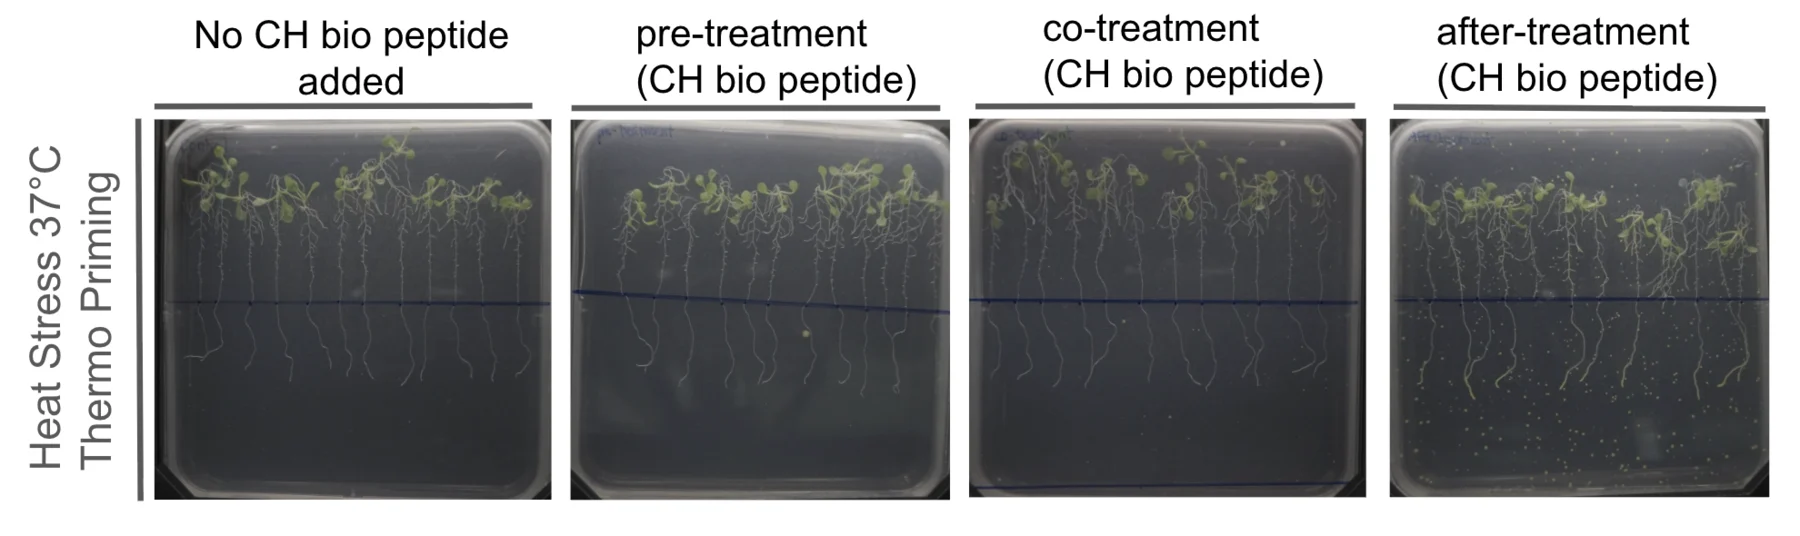
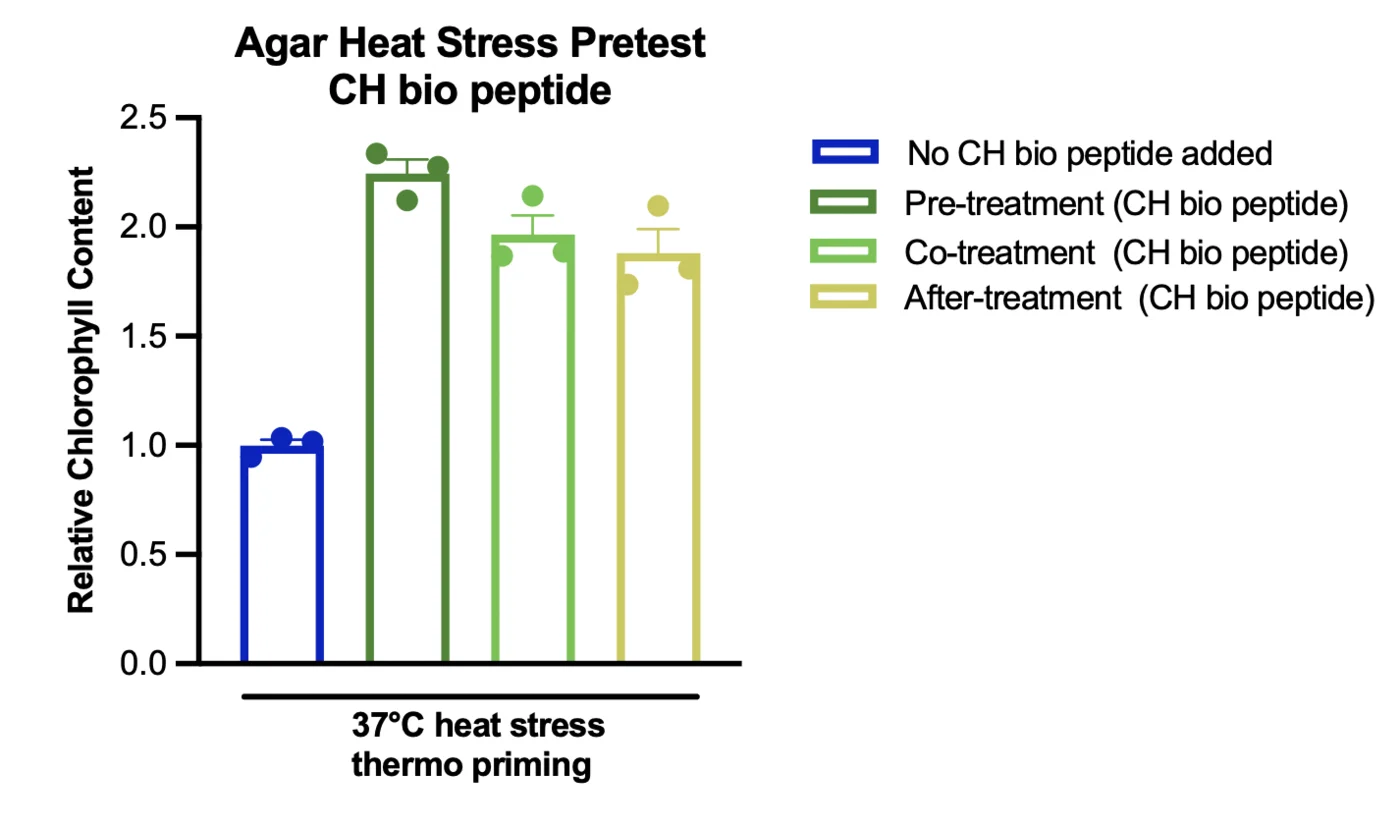
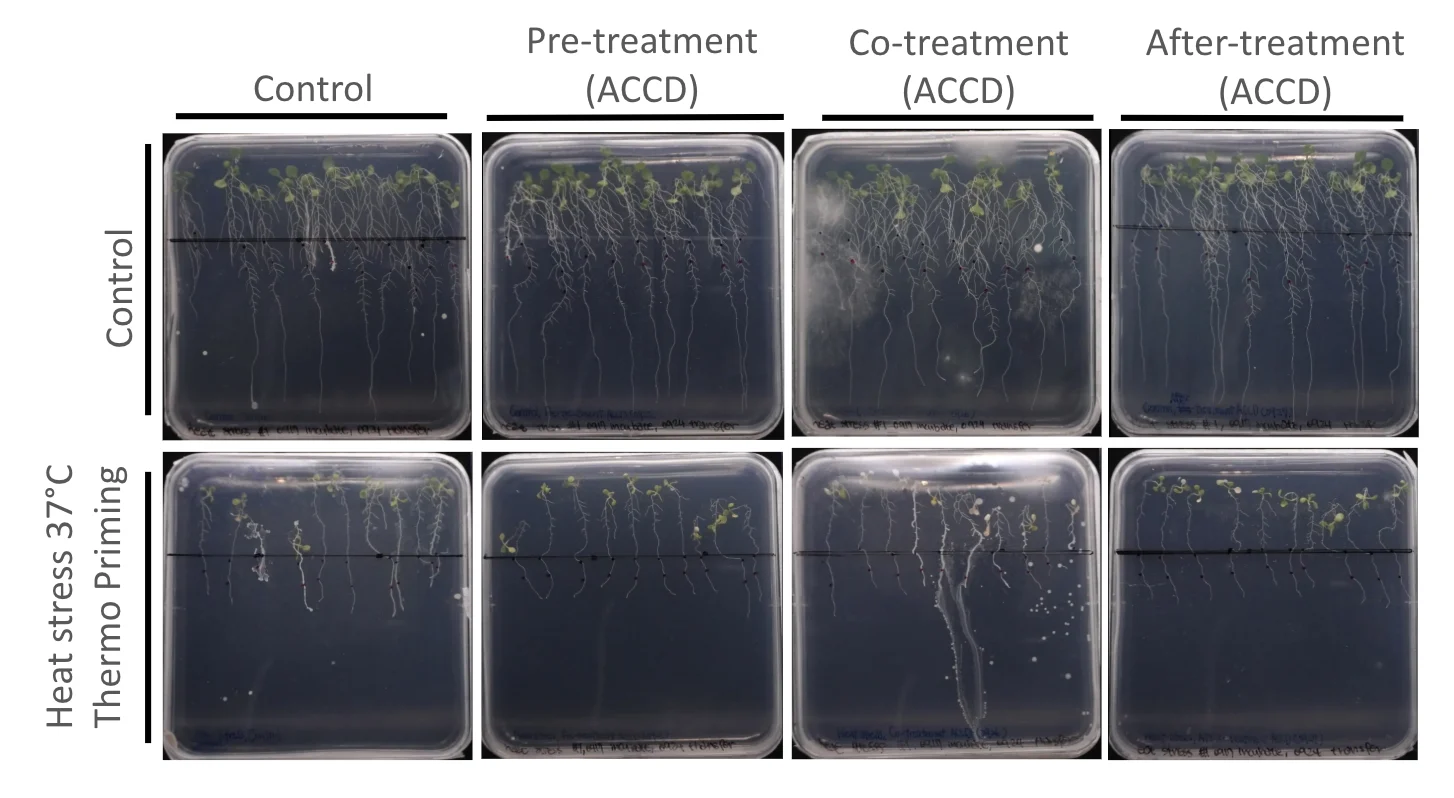
The heat stress experiments are less complete than the salt stress experiments. The CH bio peptide reference showed clear differences in chlorophyll content depending on treatment timing. For ACC deaminase, we have documented the agar plates and observed plant growth, but chlorophyll and fresh weight measurements are still being analysed. These results are needed before we can evaluate its effectiveness under heat stress and compare it with the salt stress findings.
Hydroponics
To move beyond agar-based proof of concept, we tested protectant performance in our self-made standardised hydroponic platform. The hydroponic system allowed plant roots to interact directly with the treatment solution and provided a closer approximation of how protectants could eventually be delivered through irrigation or nutrient circulation.
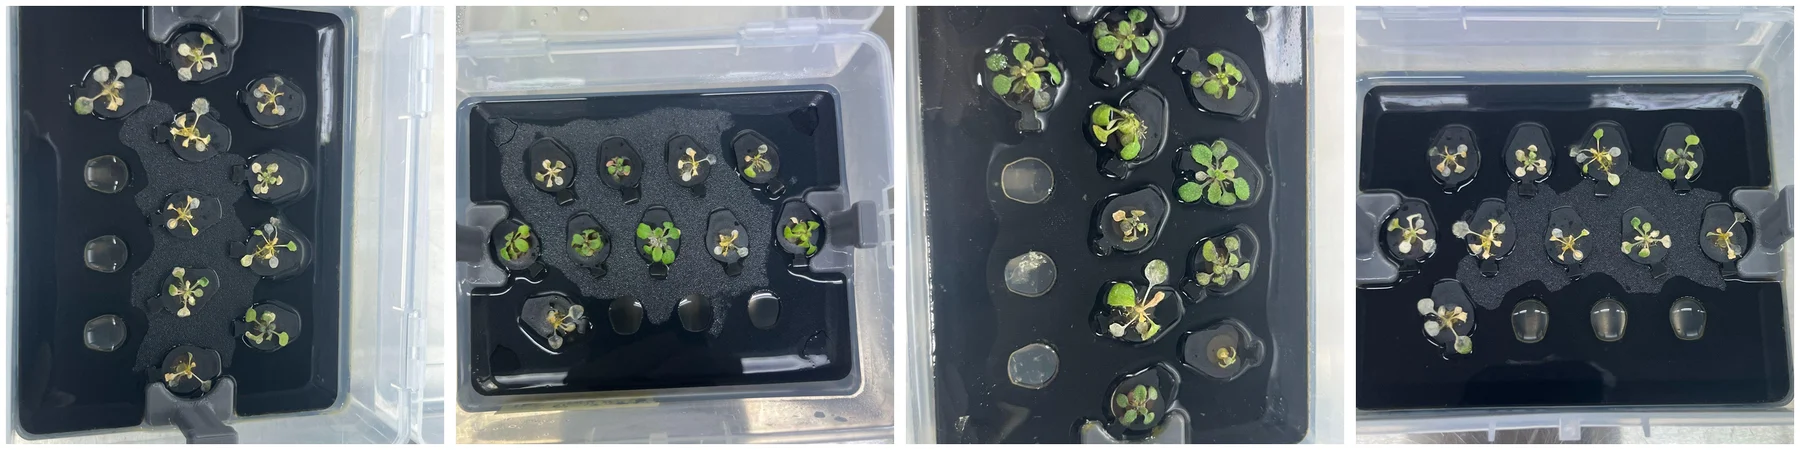
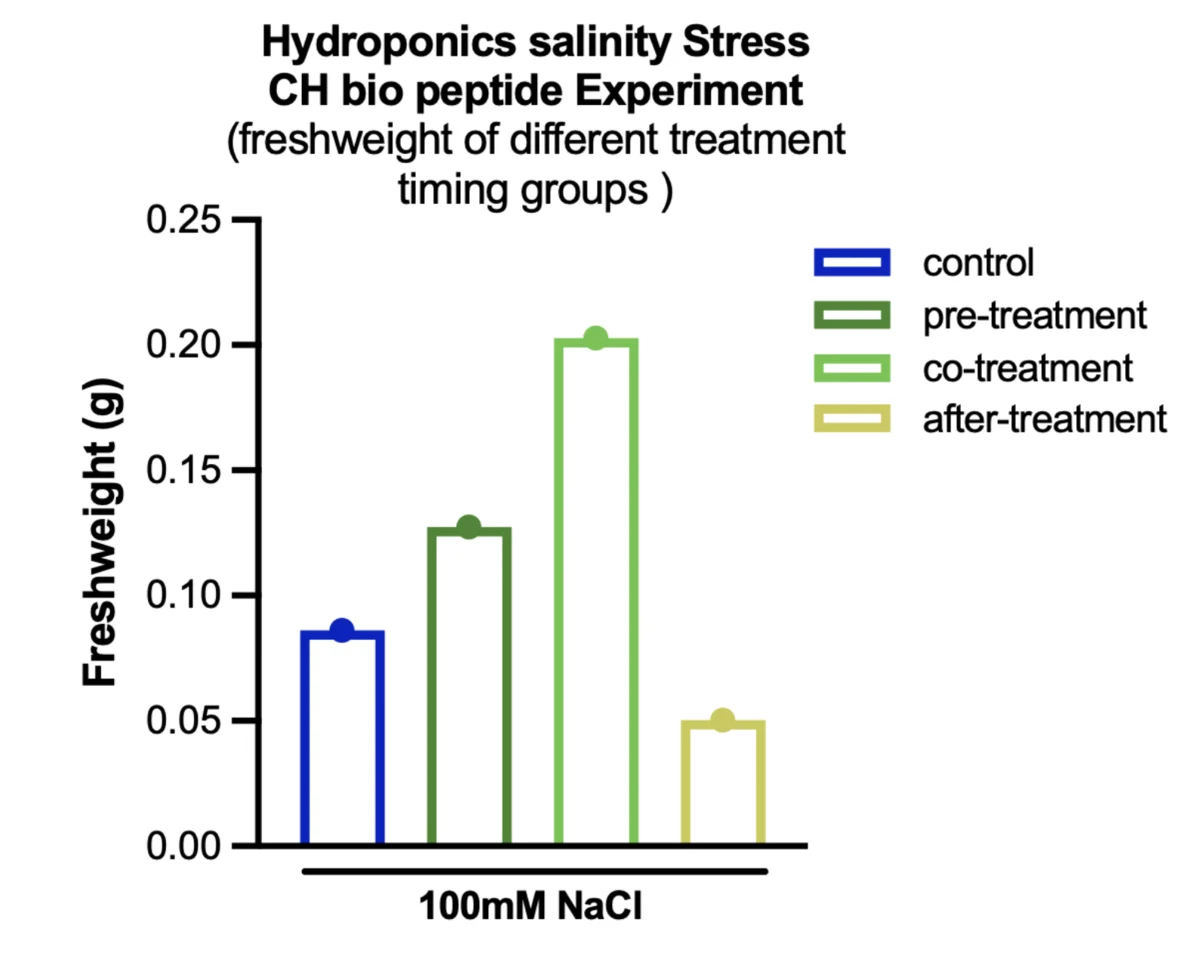
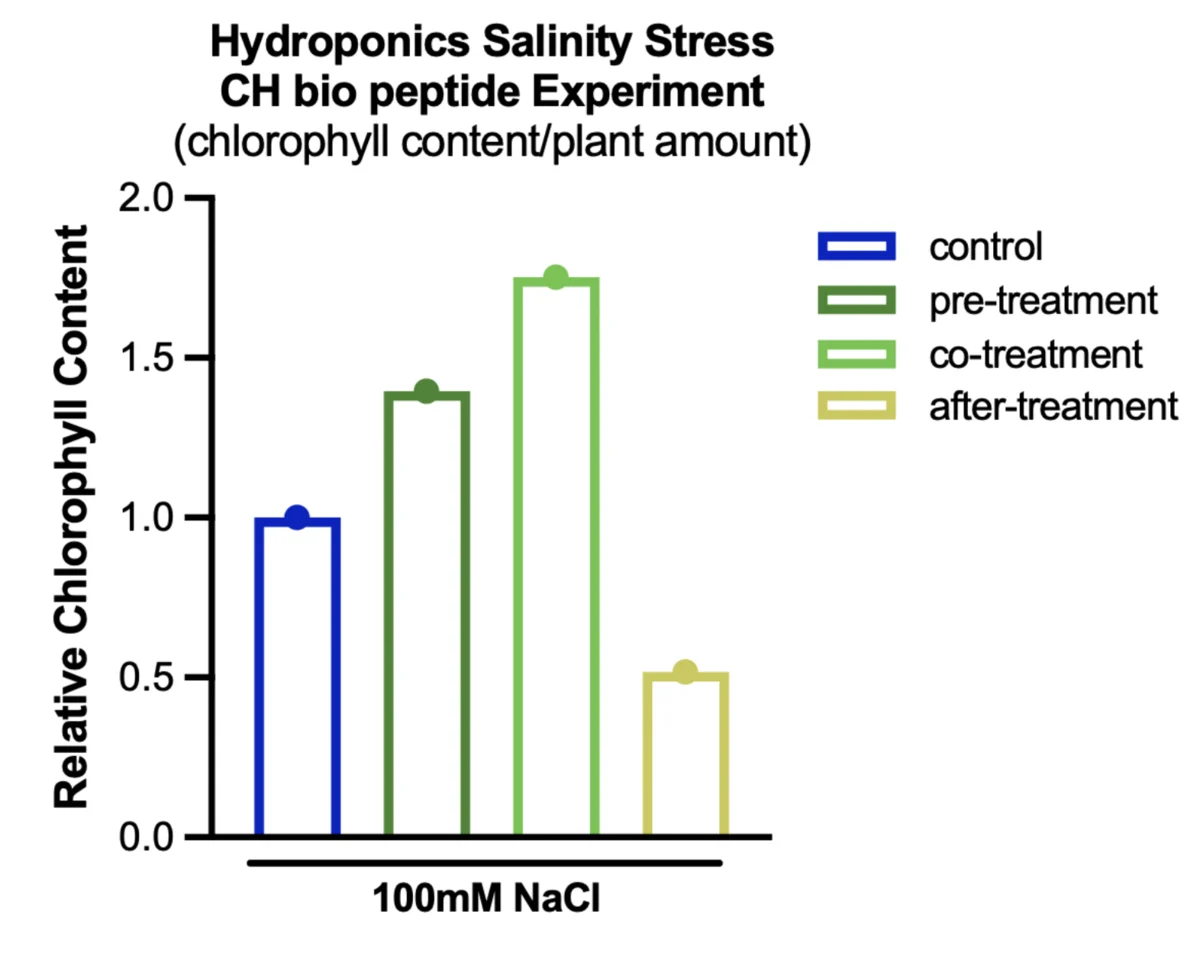
CH peptide demonstrates strong rescue effectiveness in 13-day-old Arabidopsis under 100 mM NaCl. Plants received seven days of 100 mM salinity stress, and CH peptide was applied for three days at four different times: not applied, three days before salinity, simultaneously with salinity, and three days after salinity was applied.
Co-treatment produced the highest fresh weight at 0.203 g, compared with 0.085 g in the untreated control. In contrast, post-treatment resulted in a lower fresh weight of 0.049 g. However, each group had only one measurement, so these results indicate a possible benefit of co-treatment but are insufficient to establish a statistically significant difference. The hydroponic heat stress experiment has also been completed, but its results are still being analysed.
The assays
Plant phenotype provides whole-organism evidence, and we also wanted to evaluate the biological activity of our protectant directly. For ACC deaminase we used an enzymatic activity assay to determine whether the produced protein retained measurable function.
We evaluate ACC deaminase activity using three complementary assays. The DNPH assay measures α-ketobutyrate produced by ACC deaminase, while the indophenol blue assay measures ammonia, another product of the same reaction. The anti-His ELISA described in section 4 measures enzyme concentration, allowing us to calculate specific activity once the activity measurements are available.
Quantitative results from these assays are not yet available. Therefore, while the plant experiments in section 6 showed increased chlorophyll content following ACC deaminase treatment under salt stress in one experiment, we cannot yet determine how much active enzyme was present in the applied treatment.
Whole-system validation
Can the bioreactor produce and release ACCD?
After validating individual components, we tested whether ACCD produced inside the microbial culture could be detected in the bioreactor output pathway.
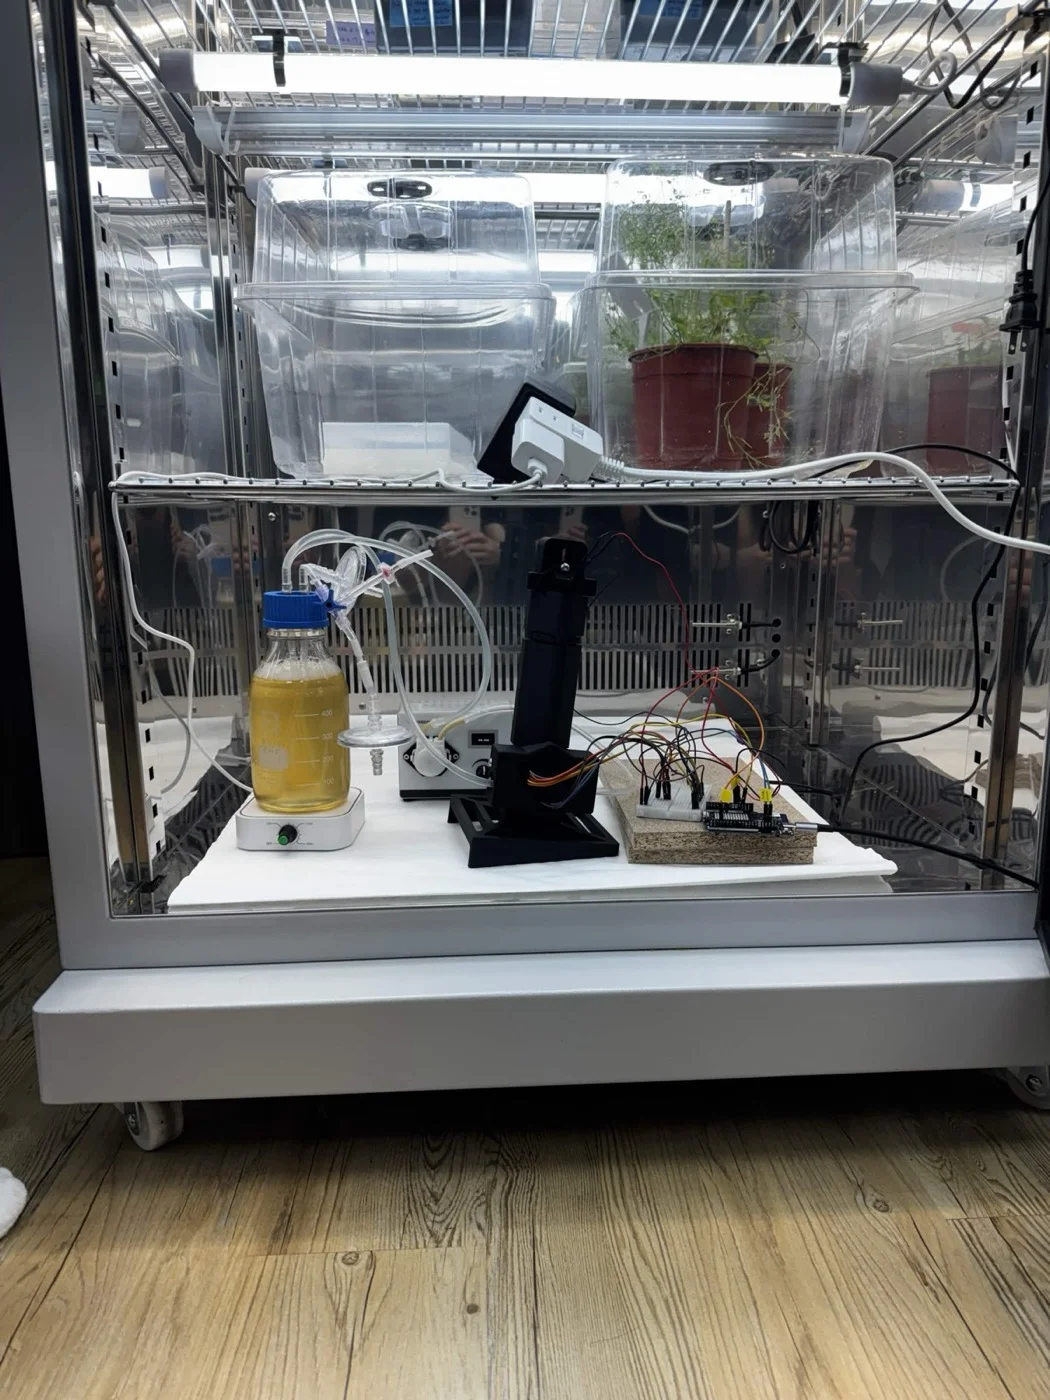
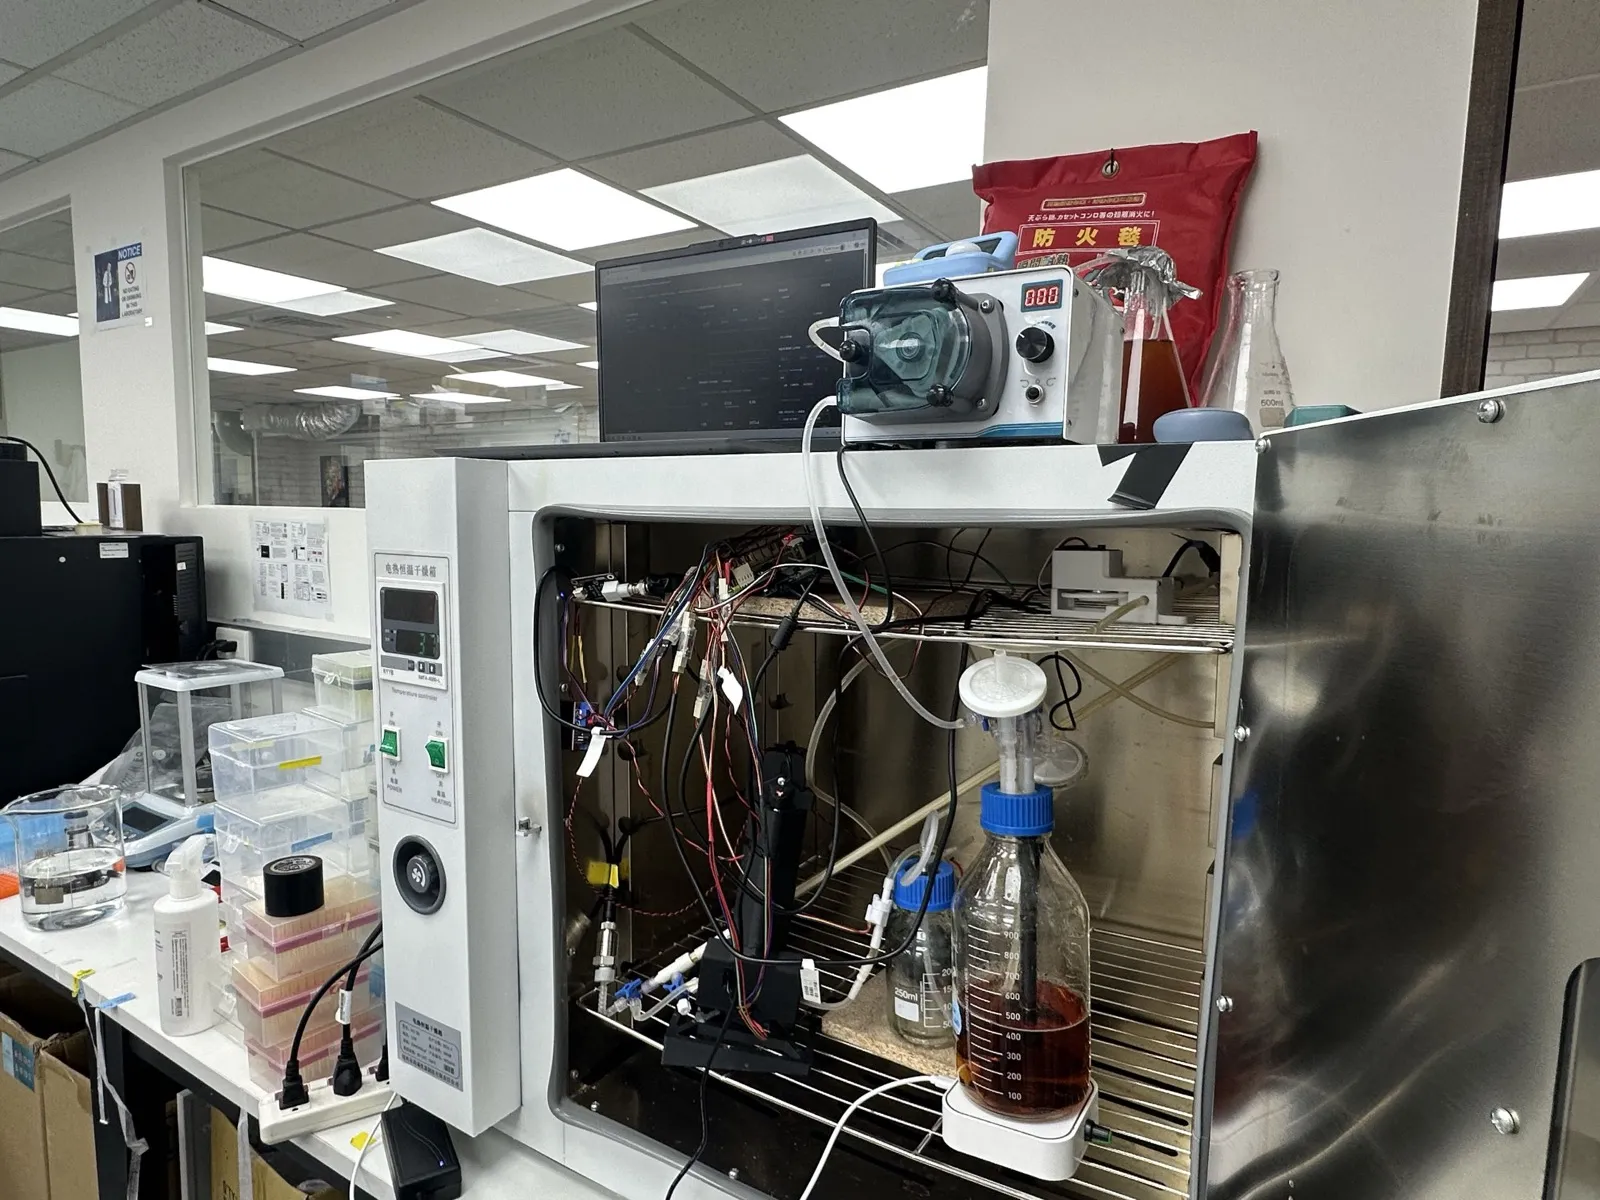
The bioreactor uses a perfusion system consisting of a PES hollow-fibre membrane cartridge with a 0.2 µm pore rating [7], approximately 200 mL of lumen volume, a medium reservoir, and a peristaltic pump. Bacterial cells are retained inside the hollow fibres, while secreted proteins pass through the membrane into the shell side, where they can be collected for future agricultural applications. Further details on the bioreactor design and fluid circulation system are available on our Hardware page.
Growth in the reactor
Our first bioreactor prototype was tested on 6 June using 300 mL of LB medium and 20 mL of overnight culture at a flow rate of 94 mL/min. The experiment ended early due to leakage at the pump. The bioreactor reached an OD600 of 0.304, compared with 0.480 in the serum-bottle control. Regression analysis of the lumen measurements showed a mean OD600 of 0.142 and a slope of −0.0024 OD/h (p = 0.759), indicating no significant growth trend. Since the control culture grew at the same temperature of 22 °C, the lack of growth appeared to be associated with the bioreactor conditions rather than temperature alone.
Possible explanations include oxygen limitation, mechanical shear stress, and cell adhesion to the hollow-fibre walls, although none has been confirmed.
For the second prototype, tested on 14 June, we introduced magnetic stirring at 200 rpm, added a sampling port between the reservoir and pump, and increased the operating temperature to 37 °C. The bioreactor reached an OD600 of 0.8–0.9 within approximately two hours, while the shake-flask control reached 0.6–0.8 after roughly 4.5 hours. These results showed substantially improved growth compared with the first prototype and suggested that stirring played an important role in maintaining favourable culture conditions. However, because both stirring and temperature were changed, the improvement cannot be attributed to stirring alone. Results from all six bioreactor runs are presented in section 5.
The 102.4 hour run
Run 4 began on 1 September using B. subtilis 168 constitutively expressing ACC deaminase in the full-length hollow-fibre module. The experiment was recorded in two datasets: an initial 3.2-hour period reaching an OD600 of 0.24, followed by a 10.2-hour recording gap and 102.4 hours of uninterrupted monitoring. The second dataset provides continuous measurements of culture growth, crossflow and transmembrane pressure, allowing us to examine their relationships throughout the experiment.
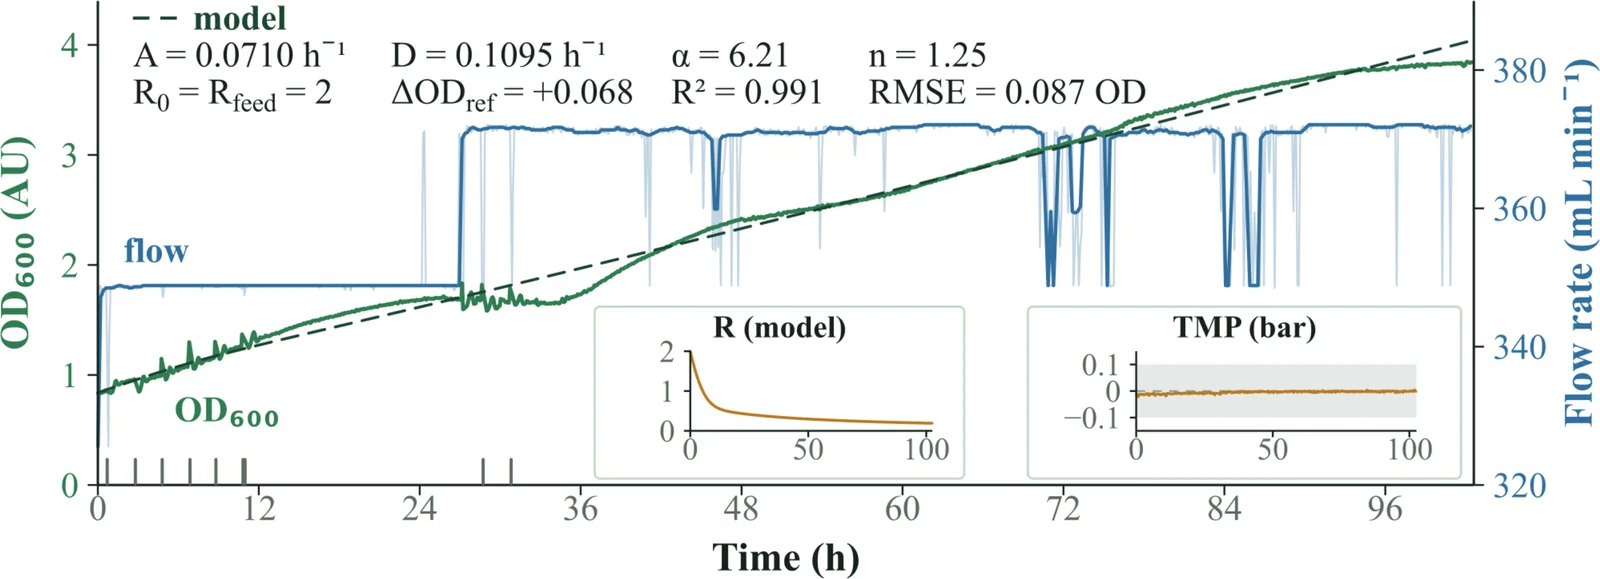
Over the course of the experiment, OD600 increased from approximately 0.8 to 3.8, while crossflow remained near 371 mL/min, apart from brief drops associated with events recorded by the dashboard. Transmembrane pressure remained within approximately ±0.1 bar throughout the run, suggesting no substantial membrane fouling during this period.
However, these results have two limitations. First, the growth model was fitted to data from a single experiment and has not been validated using an independent run. Second, the OD600 values were measured using our inline photometer, which section 5 demonstrates responds linearly to turbidity but has not yet been calibrated against bacterial cell counts. Despite these limitations, the experiment demonstrated that the bioreactor could operate continuously for more than four days without requiring intervention.
The October runs
In October, we conducted two additional bioreactor experiments using B. subtilis WB800 constitutively expressing ACC deaminase. These were our first bioreactor runs using the WB800 strain.
The first experiment, conducted from 8–10 October, experienced significant photometer interference. Although the inline OD600 reading initially increased from 0.10 to 0.30 over nine hours, it subsequently declined despite the continued presence of bacterial culture. More than 20% bubble interference was detected in approximately one-sixth of the measurement windows, while the reference beam varied by a factor of 4.8. As a result, the readings could not be reliably interpreted as a bacterial growth curve.
For the second experiment, conducted from 14–16 October, we reduced the permeate flux by half to 36 LMH and introduced an acceptance gate to filter unreliable photometer readings. The system operated continuously for 41.8 hours without restarting. OD600 increased from 0.14 to 2.71 by hour 37. Beyond approximately 2.7 OD600, the sample beam intensity dropped to one-tenth of the reference beam, making the final four hours of measurements unreliable. These readings were therefore flagged and excluded from analysis.
Using data collected between 1.5 and 6.5 hours, we calculated a specific growth rate of 0.286 ± 0.010 h−1, corresponding to a doubling time of 145 minutes. This is the growth-rate result registered on 1 October and evaluated in section 2.
The second experiment also provided our first continuous transmembrane pressure record covering an entire bioreactor run. The additional pressure required relative to clean-water operation increased gradually from 2.0 to 3.8 kPa over approximately 42 hours, without requiring membrane cleaning.
Results from both experiments, alongside the four earlier runs, are summarised on our Digital Twin page. However, neither October experiment included a B. subtilis 168 control under identical conditions, so a direct comparison between the two strains remains unavailable. Additionally, no samples were collected for cell counting, meaning the inline OD600 measurements have not been independently validated against bacterial cell concentrations.
Protectant release
We operated the bioreactor using constitutive ACCD expression and collected samples from different points in the system.
Successful protein release requires two steps: secretion from the bacterial cells and passage through the hollow-fibre membrane. We first evaluated ACC deaminase secretion using a Western blot on 2 August, comparing three fractions of B. subtilis carrying the ACCD construct: total pellet, soluble pellet and culture supernatant. Bands between 35 and 40 kDa were detected in the supernatant, while both pellet fractions showed little to no detectable signal. These results support the effectiveness of the Csn secretion tag in directing ACC deaminase into the surrounding medium, a key requirement for our bioreactor design. However, this remains our only fractionation experiment demonstrating secretion, and membrane passage must be evaluated separately.
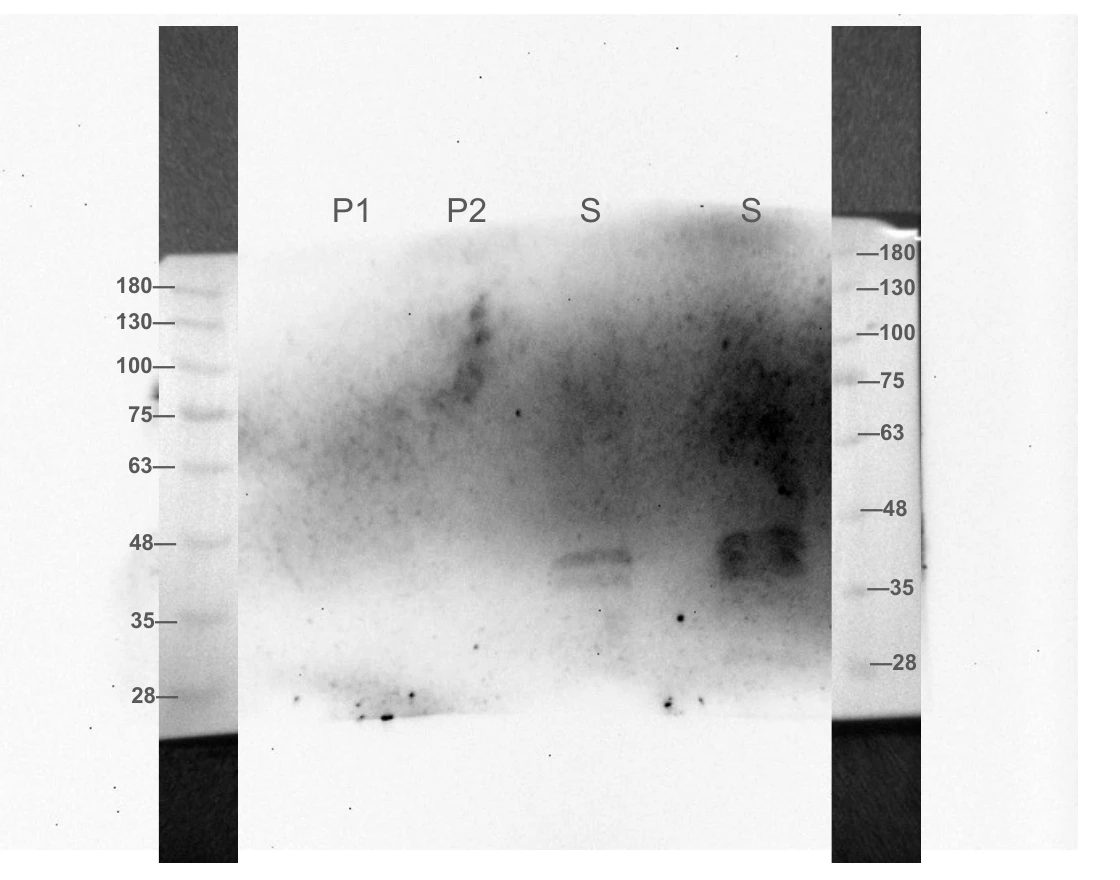
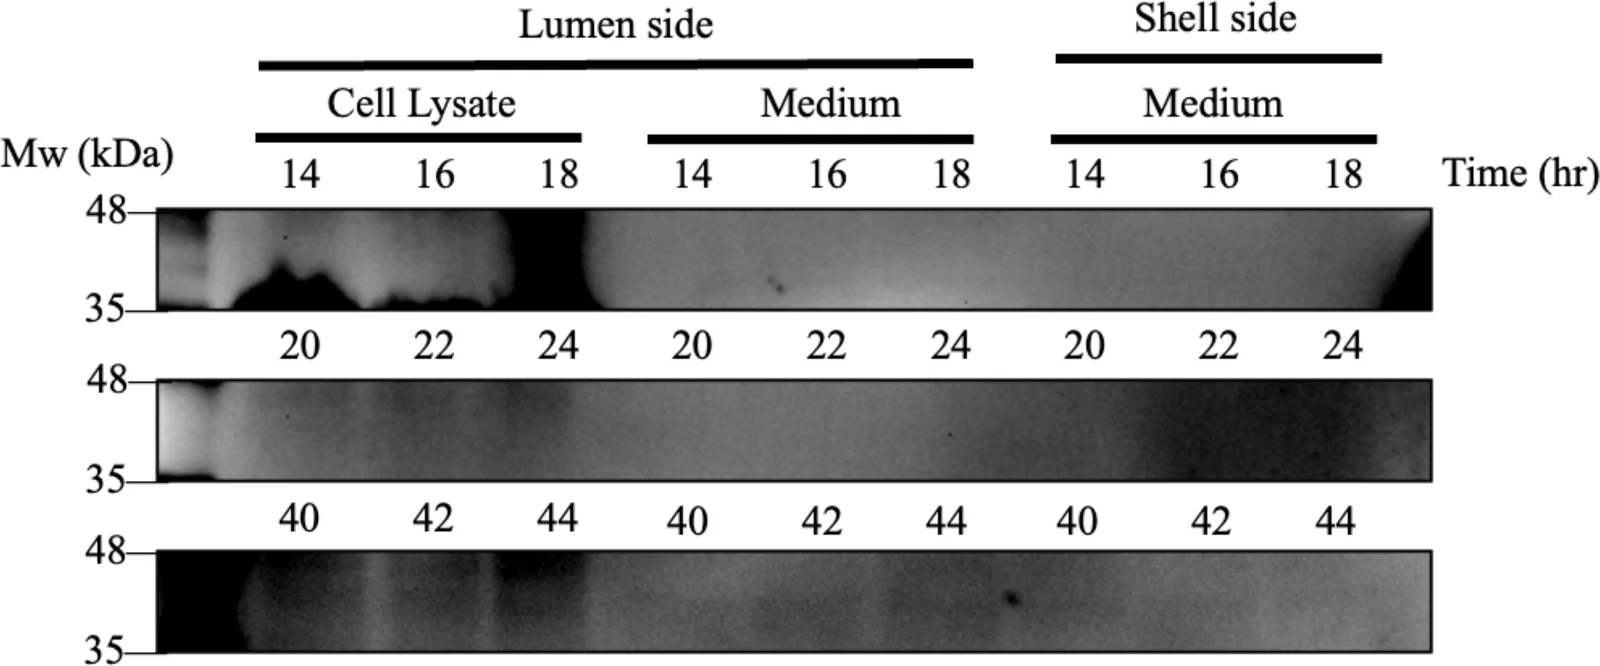
The expected molecular weight of ACCD was approximately 42 kDa. A faint band was observed near this expected size, supporting the presence of ACCD in the sampled bioreactor output pathway. This result provides preliminary evidence that ACCD produced inside the bioreactor could be released into the output pathway under the tested conditions. The weak band intensity suggests that the total ACCD yield was likely low, and indicates that protein production, membrane transport or recovery efficiency may not yet be optimised.
However, the engineering record interprets the same Western blot differently, noting that the band cannot be clearly distinguished from background noise. Given these conflicting interpretations, we cannot confirm that ACC deaminase successfully crossed the hollow-fibre membrane. Further validation would require calculating the expected molecular weight of the fusion protein, including a positive control, and reassessing the blot against both references. Until these steps are completed, membrane passage remains unverified.
Anti-His ELISA has since put a concentration on reactor samples from both October runs: ACC deaminase is present from the first hour and holds between 3.4 and 6.5 µg/mL for the length of each run, to 30 and 41 hours, with no rise over time. That quantifies what the reactor produces, which the blots above could not. It does not answer the question they left open, because the record for these samples does not say which port each was drawn from, so the concentrations cannot be assigned to the lumen or the shell side.
Safety and containment
In our trials, we ensured that the bacteria remained safely contained inside the bioreactor through shell-side plating. The hollow fibre membrane physically blocks bacteria from leaving the lumen side, since the pore size of the membrane, 0.2 µm, is much smaller than the cell size of B. subtilis.
To validate this, a simple test was conducted. While the bioreactor was running, we collected medium from the lumen and shell sides and plated both. After 24 h at 37 °C the samples were compared with each other. No detectable B. subtilis colonies were observed in the shell-side sample under the tested conditions. This provides preliminary evidence that the hollow-fibre membrane retained bacterial cells during the tested run.
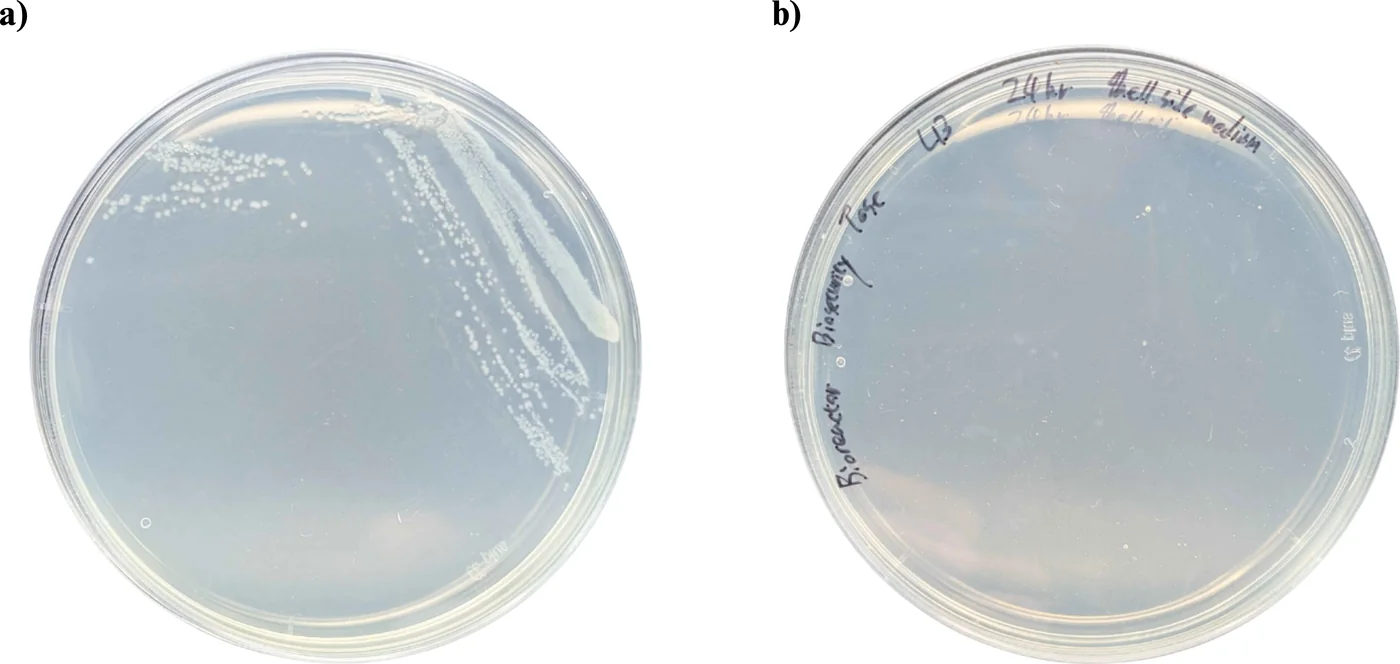
Our containment evidence comes from two plating experiments. In both cases, no bacterial colonies were observed in samples collected from the shell side of the bioreactor. The first experiment, conducted on 6 June, involved plating 2 mL of shell-side liquid, while the second compared bacterial growth in lumen and shell-side samples. However, each experiment included only one plating without replicates, and the incubation conditions for the June sample were not documented.
The containment mechanism relies on the difference between bacterial cell size and membrane pore size. Our documentation describes B. subtilis as a rod measuring approximately 1–2 µm in the containment analysis and 0.8 × 3 µm in the fouling model, both larger than the membrane's 0.2 µm pores. However, smaller particles, including cellular debris and vesicles measuring 20–200 nm, may still pass through the membrane alongside secreted proteins.
Together, these results are consistent with bacterial retention by the hollow-fibre membrane, but they do not establish a quantitative containment efficiency. Because the detection limit was not recorded and replicate experiments were not performed, further testing is needed to confirm the reliability of the containment system.
What our results show
Our experiments demonstrate progress across genetic construction, protein production, hardware development, and plant protection. We assembled 14 constructs, verified the junctions of both complete systems, and optimised electroporation conditions for B. subtilis WB800. Our light-controlled setup supported bacterial growth and produced detectable ACC deaminase bands from 2 to 16 hours. However, protein expression did not consistently increase with green light intensity, so reliable light-dependent regulation remains unverified. Anti-His ELISA has since quantified secreted protein: ACC deaminase holds between 3.4 and 6.5 µg/mL through both October reactor runs, and the light-plate pair reads 12.9 against 11.8 µg/mL at 13 h and 12.5 against 12.1 µg/mL at 16 h. ACC deaminase activity is still unquantified, and the codon-optimisation comparison the ELISA was designed for needs a CSN construct assayed beside the optimised one.
Our hardware experiments demonstrated extended bioreactor operation and reliable monitoring. The inline photometer collected 2,671 valid measurements over 434 hours, with strong linearity against commercial spectrophotometer readings using two particulate standards, R² = 0.995 and 0.992. Our sensor alarm also detected photometer deterioration 26.7 hours before failure. The bioreactor operated continuously for more than four days, and the October experiment achieved a specific growth rate of 0.286 ± 0.010 h−1. However, photometer readings have not been calibrated against bacterial cell counts, and differences between B. subtilis WB800 and strain 168 remain untested under identical conditions.
Our biological experiments provide preliminary evidence of protein secretion and plant protection. Western blot analysis detected ACC deaminase in the culture supernatant, supporting the effectiveness of our secretion tag. In Arabidopsis, root length decreased from 74.95 mm to 1.36 mm across a 0–150 mM NaCl gradient, confirming the effects of salt stress. ACC deaminase treatment also improved relative chlorophyll content compared with untreated controls across all salt concentrations in one experiment, although a second experiment showed considerable variability. Further replication is therefore needed, and the effects of LEA14 and BoPep4 on plants remain untested.
Several important steps still require validation. Protein passage through the hollow-fibre membrane has not been conclusively demonstrated, while two shell-side plating experiments showed no bacterial colonies but were insufficient to quantify containment efficiency. Most importantly, we have not yet completed an integrated experiment connecting sensor detection, light-controlled protein production, membrane delivery, and plant protection. Although individual components have shown promising results, demonstrating their coordinated operation remains the next major goal for ReLEAF.
The most important next step is to establish a clear relationship between green light intensity and protein expression, as outlined in section 3. Confirming reliable light-controlled induction would validate a central component of ReLEAF and provide the foundation for further testing of the integrated system.
References
- Castillo-Hair, S. M., Baerman, E. A., Fujita, M., Igoshin, O. A., & Tabor, J. J. (2019). Optogenetic control of Bacillus subtilis gene expression. Nature Communications, 10, 3099. doi:10.1038/s41467-019-10906-6
- Haller, D. J., Castillo-Hair, S. M., & Tabor, J. J. (2025). Optogenetic control of B. subtilis gene expression using the CcaSR system. Methods in Molecular Biology, 2840, 1 to 17. doi:10.1007/978-1-0716-4047-0_1
- Caro-Astorga, J., Rogan, M., Malcı, K., Ming, H., Debenedictis, E., James, P., & Ellis, T. (2025). SubtiToolKit: a bioengineering kit for Bacillus subtilis and Gram-positive bacteria. Trends in Biotechnology, 43(6), 1446 to 1469. doi:10.1016/j.tibtech.2025.02.004
- Singh, R. P., Jha, P. N., & Glick, B. R. (2015). Biochemistry and genetics of ACC deaminase. Frontiers in Microbiology, 6, 937.
- Beal, J., Farny, N. G., Haddock-Angelli, T., et al. (2020). Robust estimation of bacterial cell count from optical density. Communications Biology, 3, 512. doi:10.1038/s42003-020-01127-5
- van de Hulst, H. C. (1957). Light Scattering by Small Particles. Wiley. Source of the anomalous-diffraction approximation used to predict the SiO2 extinction efficiency in section 5.
- Biophsep mPES Minilab hollow-fibre module, HF-E-MI-M020-10-60-P. Vendor specification: 0.2 µm, 150 cm², 8 fibres, 1.0 mm bore, 0.25 MPa maximum transmembrane pressure.
- LEIRONG ZP4000-N79H peristaltic pump, N-tube head. Vendor specification: 230 to 2,600 mL/min. Our own calibration is on Hardware.
- Pechsrichuang, P., Songsiriritthigul, C., Haltrich, D., Roytrakul, S., Namvijtr, P., Bonaparte, N., & Yamabhai, M. (2016). OmpA signal peptide leads to heterogeneous secretion of B. subtilis chitosanase enzyme from E. coli expression system. SpringerPlus, 5, 1200.
- Brockmeier, U., Caspers, M., Freudl, R., Jockwer, A., Noll, T., & Eggert, T. (2006). Systematic screening of all signal peptides from Bacillus subtilis. Journal of Molecular Biology, 362(3), 393 to 402.
- Ying, J., et al. (2013). Secretion of heterologous α-amylase in Bacillus subtilis directed by the SamyQ signal peptide. Source of the 90% figure used in the signal peptide correction in section 4.