Digital Twin and ReLEAF's System
ReLEAF's bioreactor is built to stand beside a rice field and keep producing for weeks at a time. The person responsible for it there grows rice, and nobody with laboratory training is on hand to draw a sample or read a trace. That situation set the list of jobs before any software existed. Somebody has to see what the culture is doing while it runs. Something has to raise an alarm when a reading or the culture starts to drift, because a week can be lost before the next visit. The grower needs to know how much biomass there will be in a few hours, and whether the protectant will be ready when the crop wants it, which means watching the weather forecast and the crop as well as the vessel. And the answer has to come back in plain language, so that acting on it does not depend on reading a dashboard built for a laboratory.
Live readings alone cover only the first of those. A drift alarm needs a model of what a healthy run looks like; a delivery date needs the batch carried forward in simulation; a suggested setting needs that simulation returned to the bioreactor. This is the distinction the literature draws. A digital model represents a physical system but is updated by hand. A digital shadow receives live data automatically, but changes back to the system still need a person. A digital twin closes the loop: data flows automatically from the system to the model and back [1, 2]. The jobs above describe the third one, so that is what we built: a second simulated world running the same batch as the physical one but ahead of it, which is what lets the software hand over a risk assessment and a suggested action before the event instead of a report after it.
ReLEAF is an AIoT system: the bioreactor's sensors and valves are wired to a board that logs every reading, and models learn from those readings. The twin reads optical density, pH, pressure and flow live, and the pinch and Luer valves are commanded from the same interface. Some of what it watches sits outside the bioreactor: a sensor beside the crop reads leaf temperature and leaf wetness, two readings that together say when the weather is letting disease into the field. An autoencoder our team trained on the healthy first 120 hours of the 434-hour run flagged a failing photometer 26.7 hours before its reading became unusable (R2). One thing the twin cannot read at all is how much protectant a batch has made: that comes from a sample drawn by hand and assayed at the bench, ELISA for the amount and DNPH for the activity, and it reaches the decision through a person (section 4). The models have so far run on recorded data after each run, and a person still makes every decision. The next Digital Twin joins them to the live loop and adds the Ask tab, where a farmer with no expertise in biomanufacturing can ask about the bioreactor in plain language and act on the answer.
1What it takes in
Within the bioreactor
- Live
- OD600
- pH
- Flow rate
- Pressure × 4
At the bench
Outside the bioreactor
2What the models do
3What it works out
4What it decides
5What it acts on
- Live
- Pinch valve
- Luer valves × 4
What our digital twin measures
Within the bioreactor
| Channel | Instrument | Purpose | Provenance |
|---|---|---|---|
| Optical density 600 nm | Photometer: amber LED, 2 mm flow cuvette, sample and reference lux sensors | Biomass | live |
| pH | Arduino pH probe | Growth and secretion conditions; alarm | live |
| Pressure × 4 | Pressure transducers | Lumen ΔP, trans-membrane pressure (TMP), fouling | live |
| Flow rate | Turbine flow meter | Cross-flow, wall shear, hydraulic model (R4) | live |
| Pinch valve | Servo | Lumen isolation | live control |
| Luer valves × 4 | Valves on the loop | Routing between reservoir, module and permeate | live control |
| Lumen ΔP, TMP, fouling ratio | Pressure and flow through the hydraulic model | Membrane state; when to clean | indirect |
| Green light | Tested separately, but not integrated yet | Induces the CcaS/CcaR strain to make protectant | tested, not integrated |
| Dissolved oxygen | Had trouble calibrating our DO sensor | Measure DO | experimented, not integrated |
Outside the bioreactor
| Channel | Instrument or source | Purpose | Provenance |
|---|---|---|---|
| Leaf temperature | Leaf sensor | Leaf minus air temperature as a water-stress signal; the temperature of a wet period in the blast rule | bench tested |
| Leaf wetness | The same leaf sensor | Biotic stress detection | bench, never wetted |
| Weather forecast | Weather service | Temperature, humidity, rain, wind, evapotranspiration | external |
| Air temperature and humidity | Air sensor | Vapour pressure deficit; the reference for the leaf sensor | bench tested |
Leaf wetness and the rice blast rule
Leaf wetness on its own is not a stress for rice: the leaf sheds water as beads. It matters because a wet leaf is the condition blast fungus needs in order to infect, and whether an infection can start depends on how long the leaf stays wet and how warm it is while wet. That is why one sensor beside the crop reads both channels. The twin applies the BLASTAM rule for leaf blast [3], which counts a wet period as an infection condition when the leaf stays wet for at least 10 hours at a mean of 22 to 25 °C, asks for longer as it gets cooler, and allows no infection below 15 °C or above 25 °C [4]; a dry hour ends the period. Hours already past come from the sensor, and hours ahead are estimated from the forecast, counted as wet when relative humidity reaches 90% [5]. When a period meets the rule, the interface tells the grower to look for lesions five to ten days later.
The sensor has only been on a bench (R3), and its wet threshold is a default until a dry-down test sets it. The rule itself has not been checked against disease records from a Taiwanese field. A met condition means the weather allowed infection; whether lesions appear also depends on spores being present and on the variety and growth stage. ACC deaminase has not been tested against blast, so blast risk is shown to the grower and does not switch the green light on its own.
Results
Every run so far
| Run | Set-up | OD600 | What it gave |
|---|---|---|---|
| 1 · 6 June prototype 260606 | B. subtilis 168 WT. PES hollow fibre, lumen about 200 mL; 300 mL LB plus 20 mL overnight culture; peristaltic pump at 94 mL/min; no stirring | Hand samples to 27 h: bioreactor 0.17 to 0.37, flask to 2.46 | Stopped by a pump leak. 2 mL of shell-side liquid grew no colonies. Next: BPT tubing, stirring, sampling at the reservoir |
| 2 · 14 June prototype 260614 | B. subtilis 168 WT. Run 1 plus stirring at 200 rpm and a sampler before the pump; 37 °C; 300 mL as in run 1 | Samples every 15–20 min to 7.1 h: bioreactor 0.90 by 145 min, flask 0.83 by 278 min | Stirred bioreactor plateaued about two hours before the flask. Next: 22 °C |
| 3 · 21 July to 8 August | B. subtilis 168 WT at 22 °C, 300 mL, hollow fibre module fitted, in-line photometer | 434 h continuous, peak about 1.5 | The sensor alarm (R2) |
| 4 · 1 to 6 September | B. subtilis 168 with constitutive ACC deaminase secretion, in the incubator, full-length hollow fibre module; 1 L | Two files: 3.2 h from near zero to 0.24; 10.2 h unlogged; then 102 h from 0.84 to 3.77 | The forecast comparison (R5), on the second file; the Dry Lab Notebook's 53 hours are its first part |
| 5 · 8 to 10 October | B. subtilis WB800 with constitutive ACC deaminase secretion, 37 °C, hollow fibre module; permeate drawn at 24 mL/min, a flux of 72 LMH | 37.5 h logged over 38 h in four files: 0.10 to 0.30 in the first nine hours, then the reading breaks down | Halved flux and an acceptance gate on the photometer, both carried into run 6 |
| 6 · 14 to 16 October | As run 5, with the permeate halved to 12 mL/min, 36 LMH, and the acceptance gate running | 41.8 h continuous: 0.14 to 2.71 by 37 h, then the sample beam was lost | The registered forecast scored (R5) and a fouling trace that held |
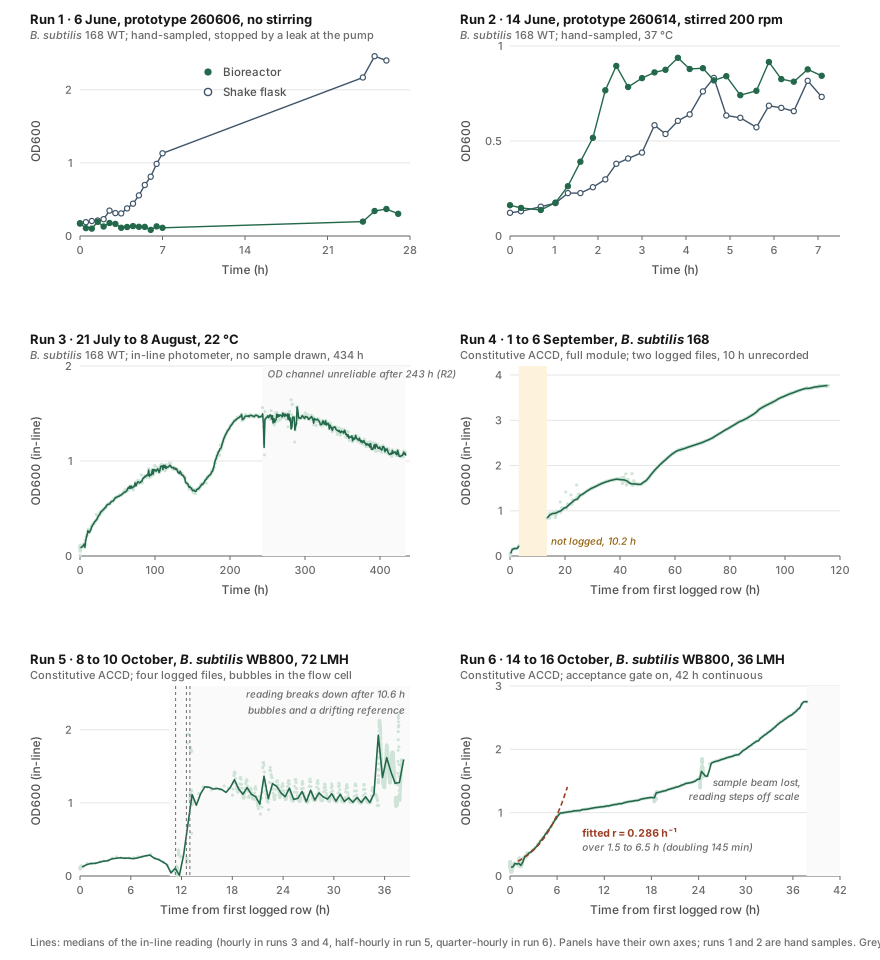
Run 5 was restarted three times, so it arrives as four files covering 37.5 of its 38 hours. The in-line reading rose from 0.10 to 0.30 over the first nine hours and then fell away while the culture was still there: a sixth of its windows carried more than 20% bubbles, and the reference channel, which never passes through the culture, moved by a factor of 4.8 across the run. Nothing after 10.6 hours can be read as a growth curve. The pH channel then held at 6.90 for twenty hours, which is the probe and not the culture.
Run 6 is the same strain with two changes. The permeate was drawn at half the rate, 12 mL/min against 24, and the photometer was given an acceptance gate that holds the last good value when a window fails its own checks. It ran 41.8 hours without a restart. The gate turned away 31 of 1,083 windows, no window carried more than 20% bubbles, the reference held within 17%, and the trace came out clean: 0.14 at the first window, 1.01 at 7 h, 2.71 at 37 h. After that the sample channel fell to a tenth of the reference and the reading stepped to about 9.9 and stayed there, flagged as low signal, and the twin does not use it. pH fell from 6.93 to 6.41 over the first seventeen hours and then stepped back to 7.0 inside one window, which the log does not explain.
The pressure the module needed beyond what its own geometry needs for clean water rose from 2.0 to 3.8 kPa over those 42 hours. That is the fouling signal the twin watches for, and at 3.8 kPa it is far from the point where the membrane would have to be cleaned. Two excursions break that line, at 1.1 h and 24.3 h. In both the permeate pressure reads zero while the feed rises, so both are the permeate side being opened and neither is the membrane.
Photometer calibration against TiO₂ and SiO₂
TiO₂, 23 August
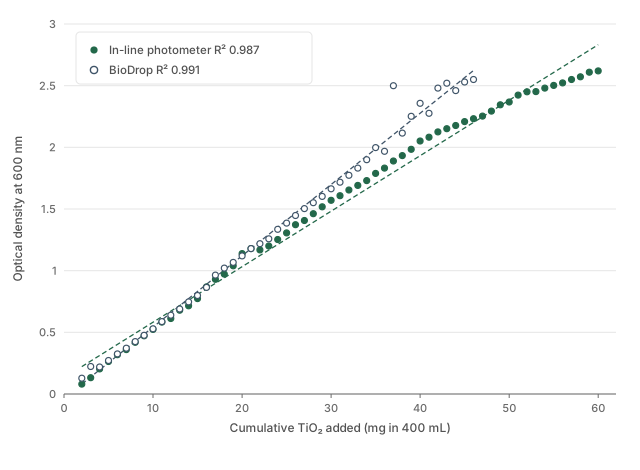
On 23 August 2026, cumulative TiO₂ additions into a stirred 400 mL loop gave 45 paired points between the in-line photometer and the BioDrop spectrophotometer. Up to an optical density of 1.2 the photometer follows the BioDrop with slope 1.018 and R² 0.995.
SiO₂, 10 October
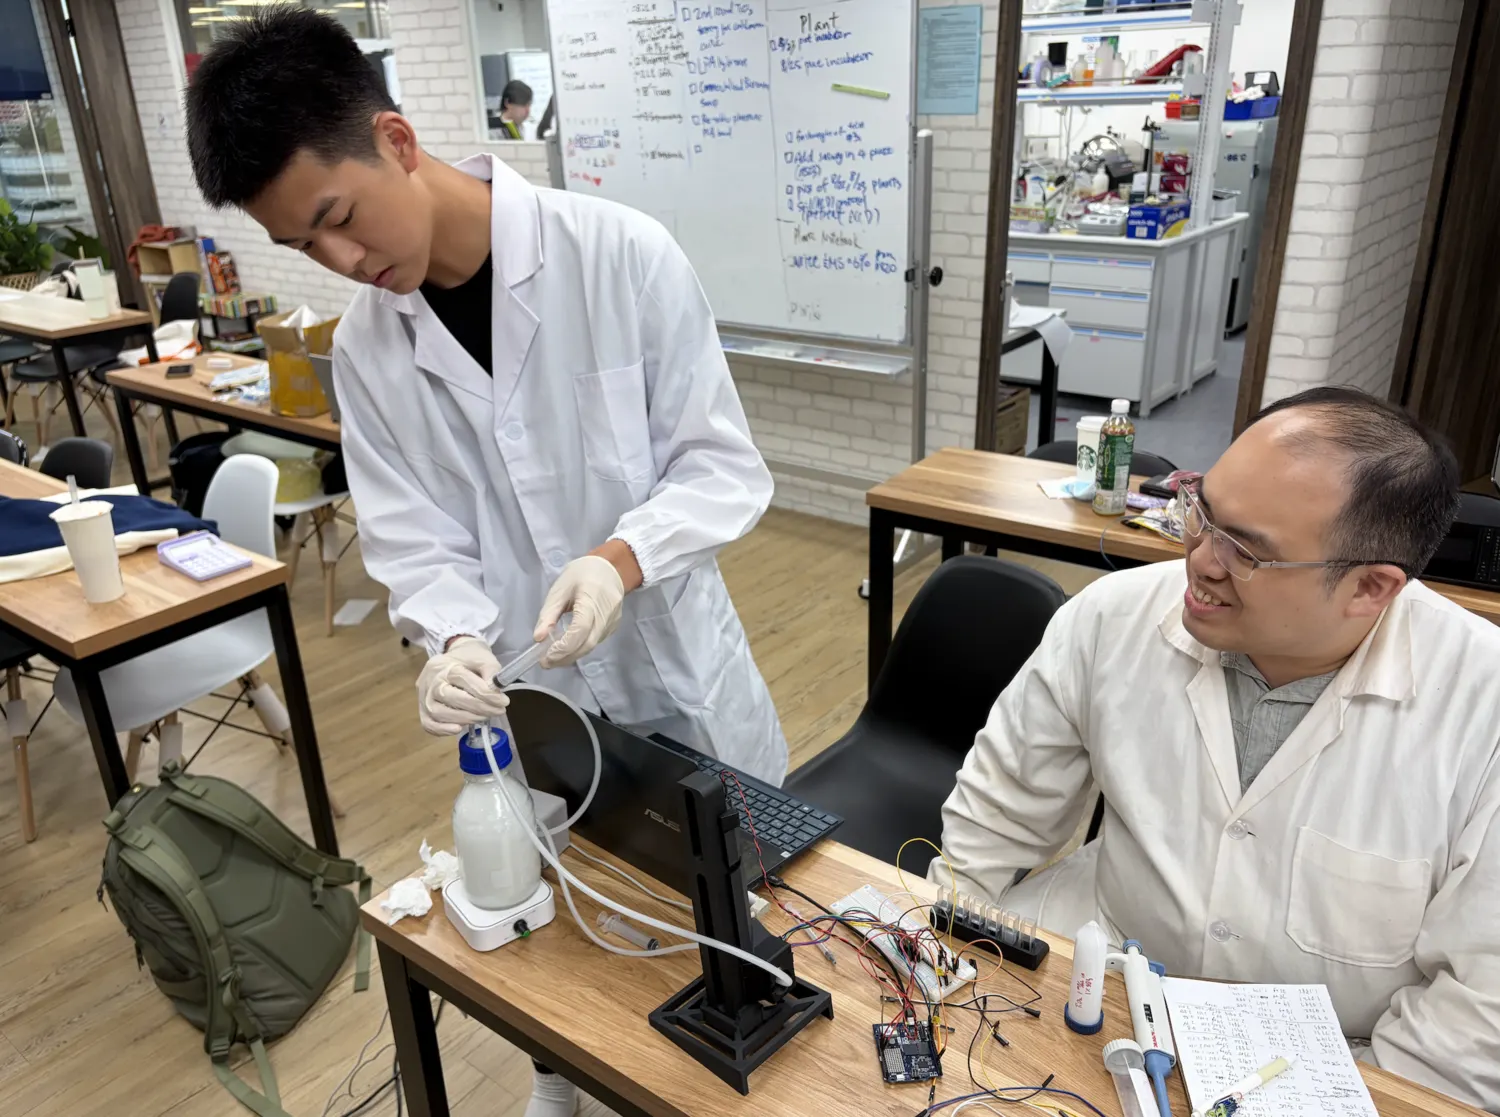
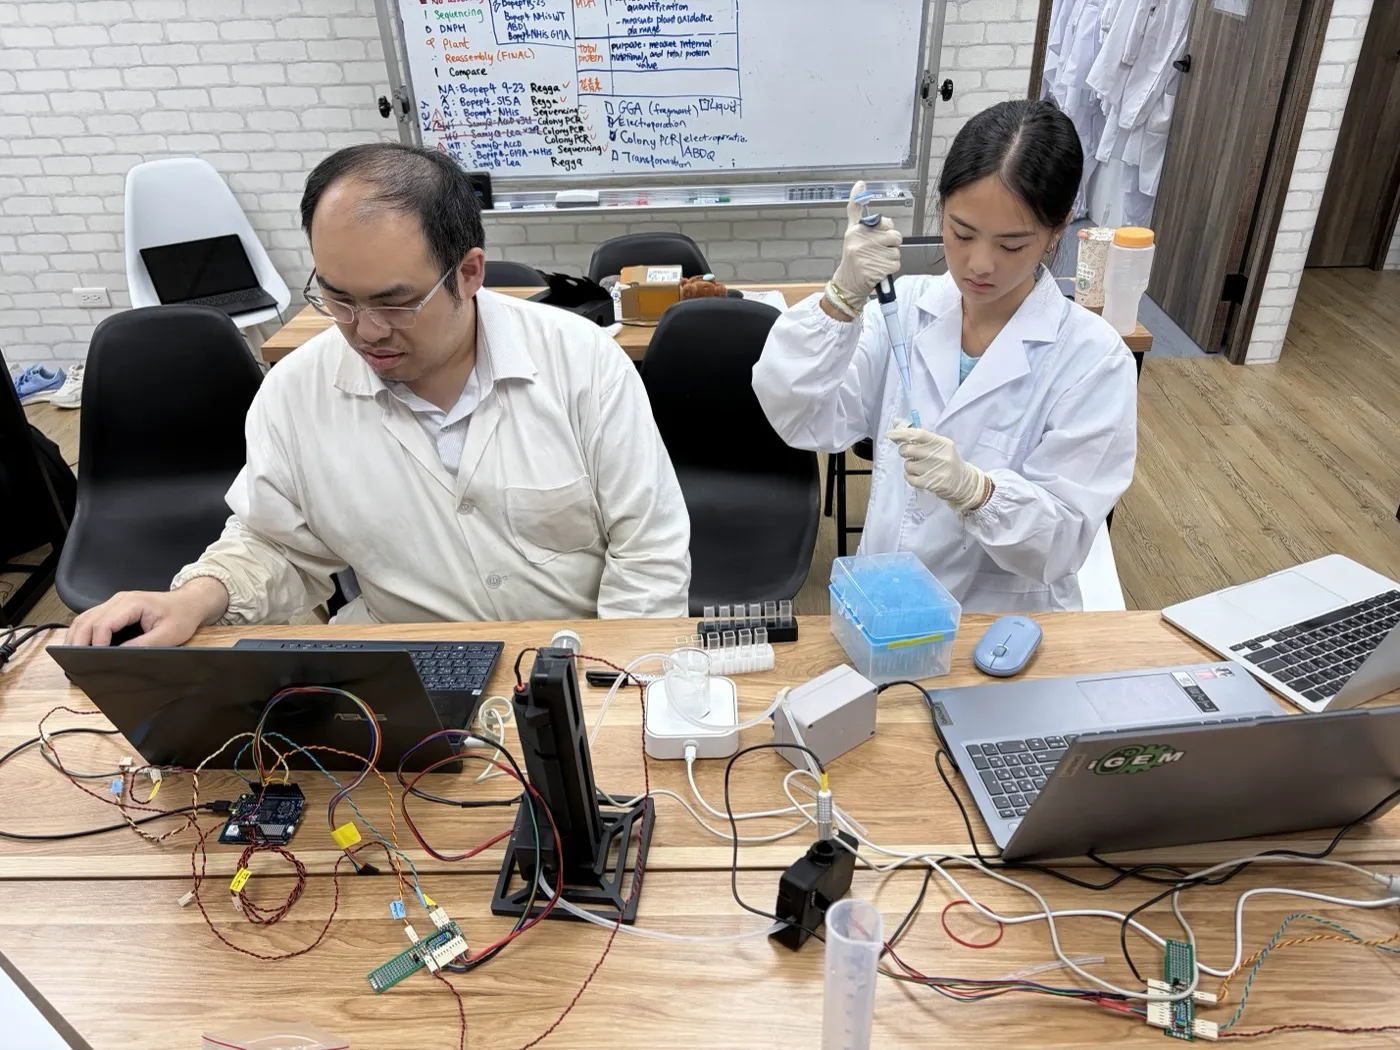
On 10 October 2026 the same loop ran the calibration iGEM's protocol actually asks for: silica in 2.5 mg steps from 2.5 to 100 mg in 500 mL of 1% SDS, read at every step on the BioDrop and on both photometer builds, and logged in-line every five seconds for 4 h 27 min.
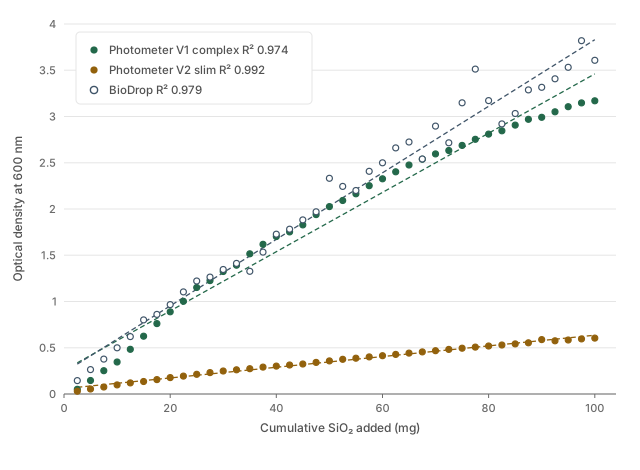
The run carries its own check. At 137.6 min the suspension was diluted and then restored, which tests proportionality without the dose being known: 2.3610 before (SD 0.0033, 29 readings), 0.7943 after (SD 0.0017, 38), and 2.3665 restored (SD 0.0157, 16). The ratio across the dilution is 2.97 one way and 2.98 the other, and the restored reading returns within 0.2% of the original. A reading of 2.36 therefore carries the same proportional meaning as one of 0.79, which is the property a calibration needs for the twin to compare one reading against another.
The 434-hour run
21 July to 8 August 2026: 434 hours of wild-type B. subtilis 168 at 22 °C with the hollow fibre module fitted, 2,671 valid rows of 2,720 logged, no sample drawn. Two axes are scored separately: a sensor axis on the reference beam, which never passes through the culture, and a process axis on the specific growth rate.
| Window | What happened | Sensor axis alarms | Process axis alarms | Interpretation |
|---|---|---|---|---|
| 120–160 h | OD falls 0.93 to 0.72; reference normal | 0% | 73% | Process event |
| 220–240 h | Reference steps 26.67 to 25.83 lux; OD still clean | 100% | 0% | Photometer drifting while OD still looks fine |
| 240–434 h | Reference collapses; OD scatter 5 to 10× higher | 100% | 35–36% | Photometer and OD both unreliable |
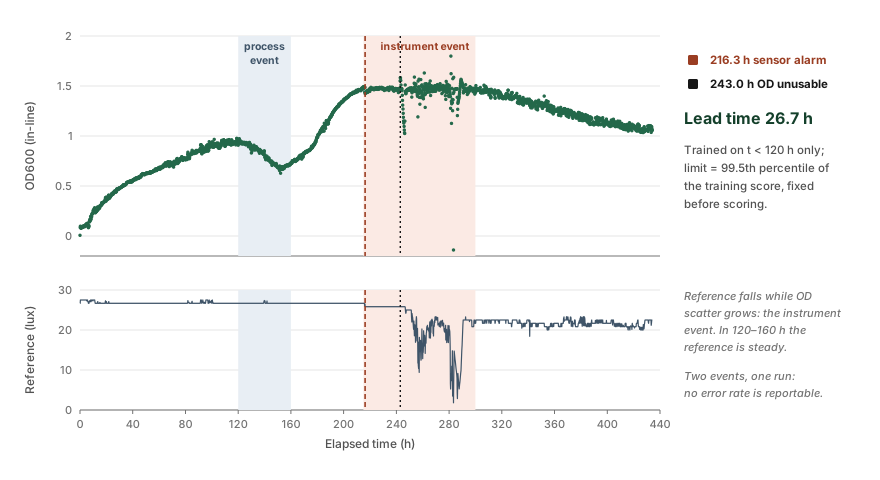
The sensor alarm flagged the photometer at 216.3 h, 26.7 h before the OD channel failed completely at 243.0 h: enough time for a controller to drop the faulty feed.
The leaf and air sensors on the bench
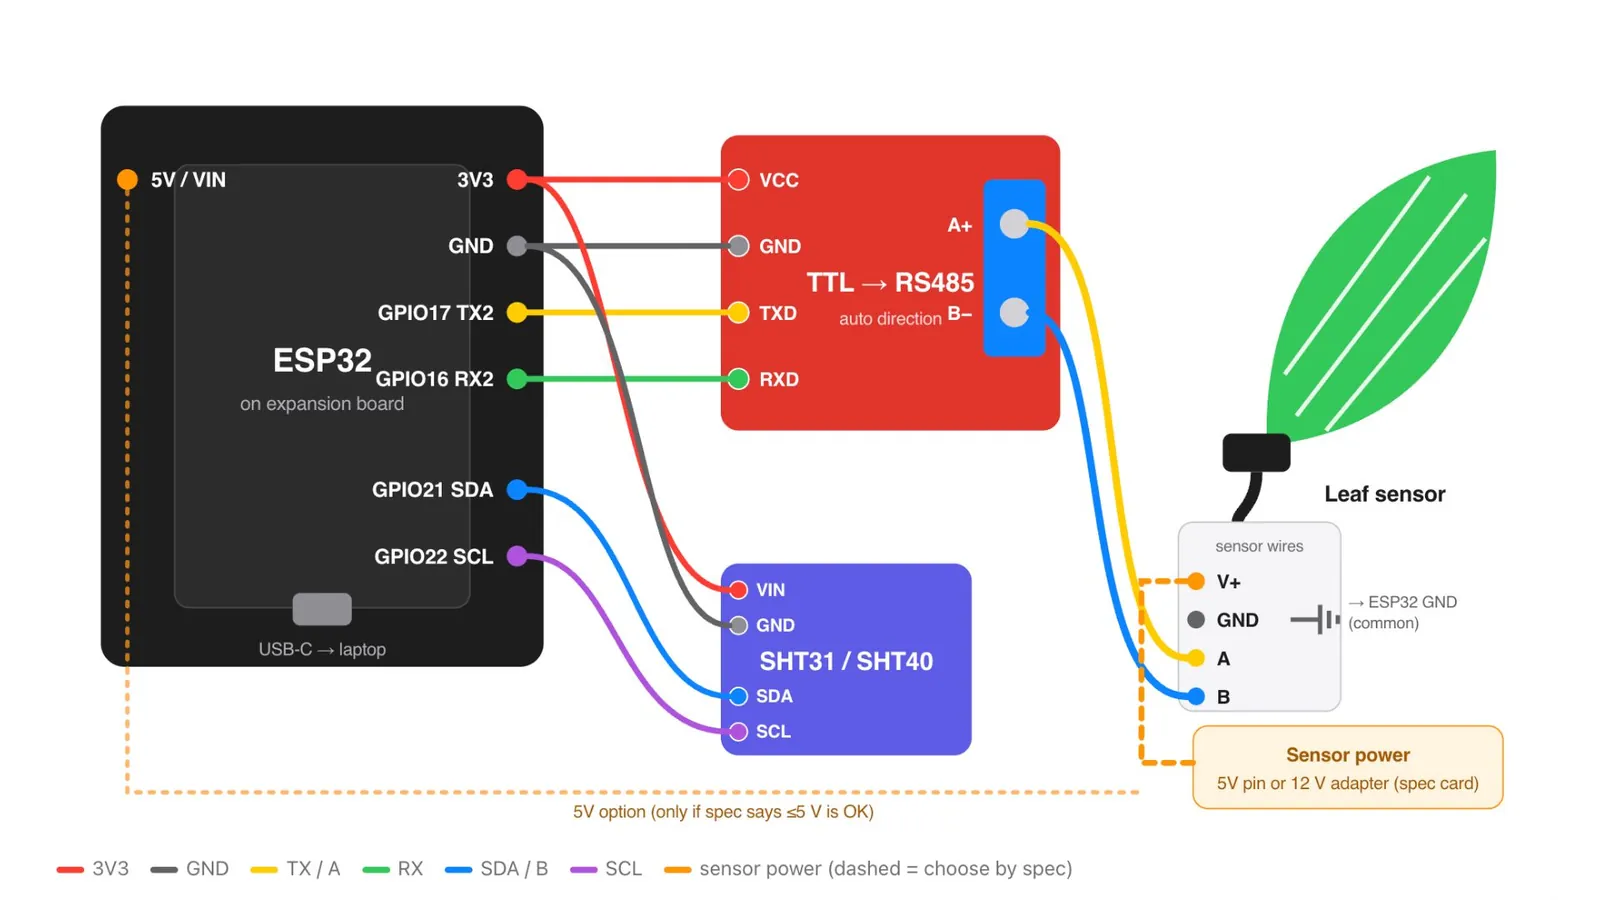
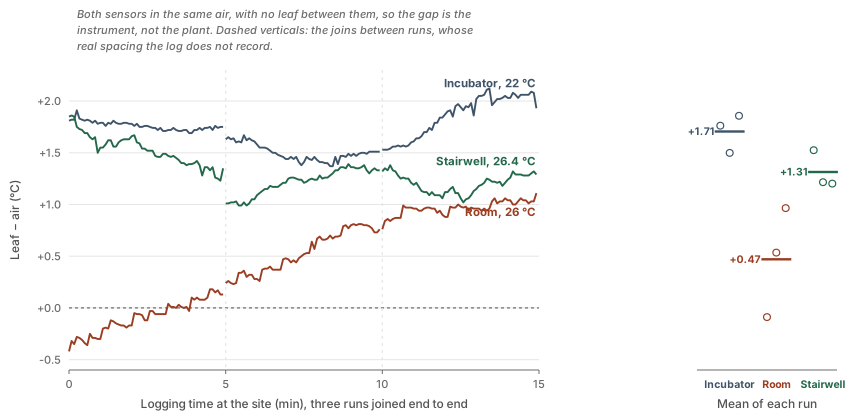
On 10 October 2026 the field sensor rig was tested at three sites with stable air temperature: an incubator at 22 °C, a room at 26 °C and a stairwell at 26.4 °C. The rig is an ESP32 reading two sensors: an SHT31 for air temperature and humidity, and an SN-3001-YM-N01 for leaf temperature and leaf wetness over RS485. Both sensors were held in air beside each other, with no leaf. Each site had three five-minute runs logged every five seconds, giving 540 paired readings.
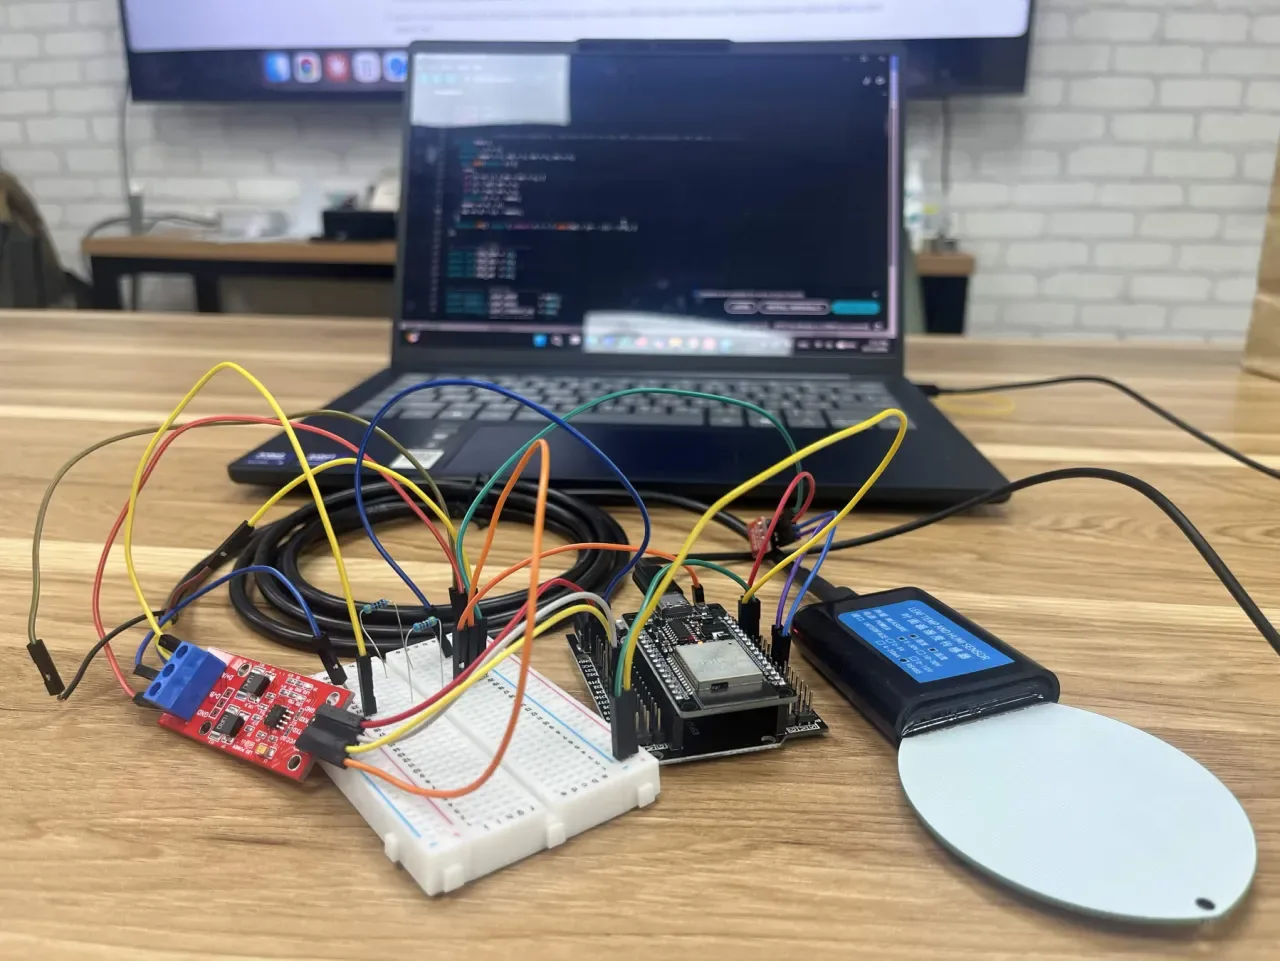
The SHT31 matched the nominal temperature of each site. Sharing the same air, the two sensors should agree, yet the leaf sensor read 1.2 to 1.9 °C warmer once settled, and the size of that gap changed from site to site, so one fixed offset will not correct it.
| Site | Air temperature | Air humidity | Leaf − air, site mean | By run |
|---|---|---|---|---|
| Incubator, 22 °C | 21.81 to 22.64 °C | 34.7 to 36.2% | +1.71 ± 0.20 °C | +1.76, +1.50, +1.86 |
| Stairwell, 26.4 °C | 26.20 to 26.81 °C | 55.8 to 61.9% | +1.31 ± 0.19 °C | +1.52, +1.22, +1.20 |
| Room, 26 °C | 25.52 to 26.20 °C | 58.9 to 62.0% | +0.47 ± 0.46 °C | −0.09, +0.54, +0.97 |
Leaf wetness read 0.0% in every sample. The sensor was never wetted, so this test cannot yet show whether the channel responds.
In the field the leaf sensor will be on a plant and the two readings are expected to differ: the leaf minus air temperature difference is one of the signals of water stress. A bias of 1.2 to 1.9 °C is large enough to hide that signal or invent one, so it has to be measured and removed before the twin acts on it.
Module pressure drop
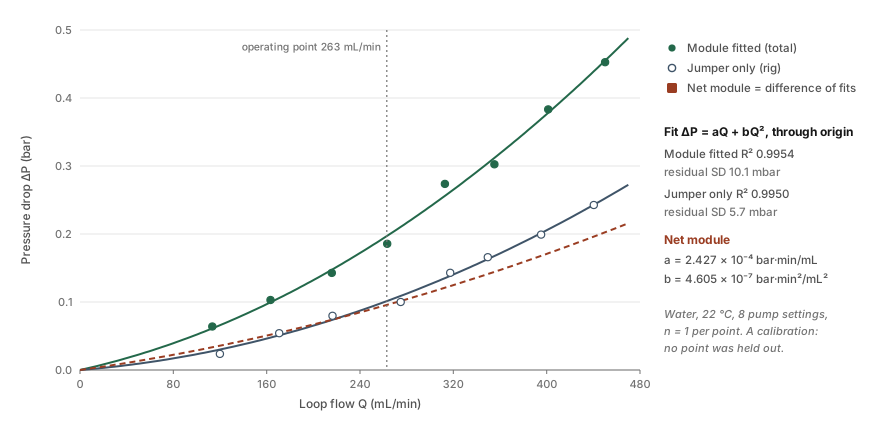
On 16 August 2026 we pumped water at 22 °C through the bioreactor at eight pump speeds and measured the pressure lost along the way, once with the hollow fibre module in place and once with a plain tube where the module sits. At 263 mL/min, the flow we run at, the module loses 0.096 bar, 1.03 times what the textbook formula predicts for 11 open fibres, so none are blocked. At that flow the force of the liquid on the fibre walls, calculated once from the pressure sensors and once from the flow meter, agrees to 2.8%, so each sensor can check the other.
Batch forecasting
We ran 102 hours of perfusion, 2 to 6 September 2026, with B. subtilis 168 secreting ACC deaminase constitutively; OD600 rose from 0.84 to 3.77. We compared Kalman filter, local linear, global linear and exponential forecasts against persistence, which predicts no change. A forecast was made every hour from 12 h, each using only data up to that point.
| Horizon | Persistence RMSE | Kalman RMSE | Improvement |
|---|---|---|---|
| 2 h | 0.067 | 0.040 | 41% |
| 4 h | 0.132 | 0.083 | 38% |
| 8 h | 0.256 | 0.192 | 25% |
| 12 h | 0.373 | 0.310 | 17% |
Most of the run is above the linear limit. The 12-hour median OD rose from 1.06 to 3.75, so R5 forecasts the photometer reading, not biomass. The model comparison still holds, because every model forecasts the same signal.
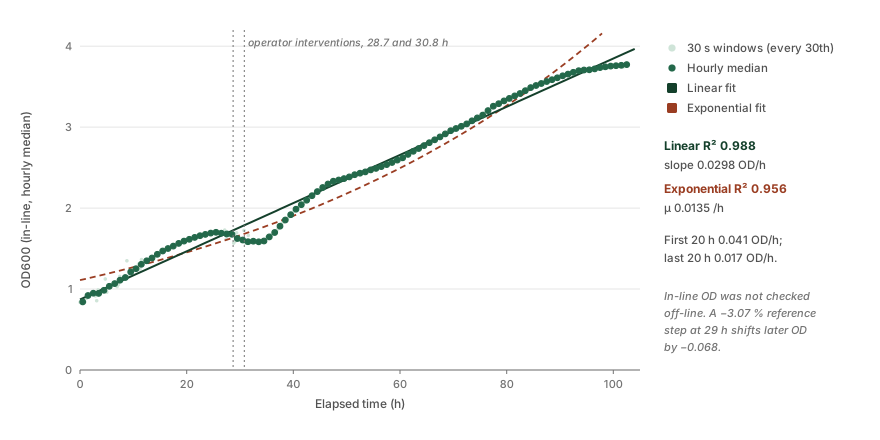
Global linear weighs early data as much as recent data, so it points the wrong way when growth changes speed. Exponential assumes growth keeps accelerating, which it does not over 102 hours of perfusion, so it overshoots. Local linear follows the recent level and slope; the Kalman filter also weighs each reading against the noise, so it follows real changes without chasing scatter.
Registered forecast
To test the forecast on a run it had not seen, we registered it on 1 October 2026, before any bioreactor run of B. subtilis WB800 with constitutive ACC deaminase secretion. The prior comes from the light plate (R6). Run 5 was the first such run; its reading broke down after ten hours, so the forecast is scored on run 6.
| Registered prediction | Value | Criterion for passing |
|---|---|---|
| Specific growth rate r | 0.2986 h⁻¹, 90% interval 0.2705 to 0.3300 (doubling time 139 min, 126 to 154) | The fitted r falls inside the interval |
| Growth curve shape | Logistic, prior-predicted trace | NRMSE below 15% [6] |
| Time to OD 0.5 | Conditional on the measured inoculum: 7.3 h from OD 0.10, 9.8 h from 0.05, 13.0 h from 0.02 | Observed time inside the 5–95% band |
Only r is scored. \(K\) and \(X_0\) were fitted on the plate-reader scale in a 150 µL well, and the bioreactor reads a 2 mm in-line flow cuvette with no cross-calibration between the two yet, so they stay out of the primary endpoint instead of being quietly rescaled. The light plate's temperature was not recorded and our 37 °C shake-flask fit is about four times faster, so the criterion does not apply to a batch run at 37 °C.
If the rate fails and the shape passes, the curve is right and the rate is not, and temperature is the first place to look. If both fail, the prior does not cross from plate to bioreactor, and we will report that as a result. The same batch carries the first ACC deaminase activity assay, which gives the product a measured quality attribute; ELISA follows on the CcaS/CcaR version once the western blot band is strong enough.
What run 6 gave
| Endpoint | Registered | Run 6 | Verdict |
|---|---|---|---|
| Specific growth rate r | 0.2986 h⁻¹, 90% interval 0.2705 to 0.3300 | 0.286 ± 0.010 h⁻¹ (doubling 145 min), R² 0.978 on quarter-hourly medians from 1.5 to 6.5 h | Inside the interval |
| Growth curve shape | Logistic, NRMSE below 15% [6] | The prior trace misses the first seven hours by 30%, and the run passes the prior's ceiling of 1.005 before hour 7, reaching 2.71 by hour 37 | Not scored |
| Time to OD 0.5 | 6.1 h from an inoculum of 0.14 | 3.6 h | Not scored |
The scored endpoint passes: the rate fitted to run 6 sits inside the interval registered thirteen days before it, from a prior fitted in a 150 µL well on a plate reader. Two things keep that from being more than it is. The fit runs over five hours in which a straight line describes the readings at least as well as an exponential, with half the residual sum of squares, so the rate is read from a stretch where the two shapes cannot be told apart. And the two secondary endpoints stay unscored for the reason given when they were registered: both depend on \(K\) and \(X_0\) on the plate-reader scale, and no cross-calibration between that scale and the in-line cuvette exists yet. The bioreactor passed the plate's ceiling in seven hours, which is the size of that gap.
Light plate
On 19 September 2026, B. subtilis WB800 grew in light-programmable array wells under six light arms, read on a plate reader at five time points to 24 h. A logistic model beat logistic-with-lag by AICc and fits at NRMSE 1.9% (R² 0.997), against the 15% criterion for bioprocess models [6]: \(r = 0.299 \pm 0.017\;\mathrm{h^{-1}}\) (doubling time 139 min), \(K = 1.005\), \(X_0 = 0.0235\).
To test the fit as a prior, we left out each arm in turn, fitted the other five, and predicted its 24 h OD from its first 8 hours, with and without the prior.
| Arm | Observed OD at 24 h | With the prior | Without the prior |
|---|---|---|---|
| R1 weak red | 0.967 | 0.972 | 0.306 |
| R2 medium red | 0.910 | 0.973 | 0.296 |
| R3 high red | 0.967 | 0.969 | 0.355 |
| G1 weak green | 1.014 | 0.958 | 0.666 |
| G2 medium green | 0.975 | 0.977 | 0.695 |
| G3 high green | 0.958 | 0.986 | 0.502 |
With the prior the error was at most 7%; without it, 29 to 68%, from the same eight hours.
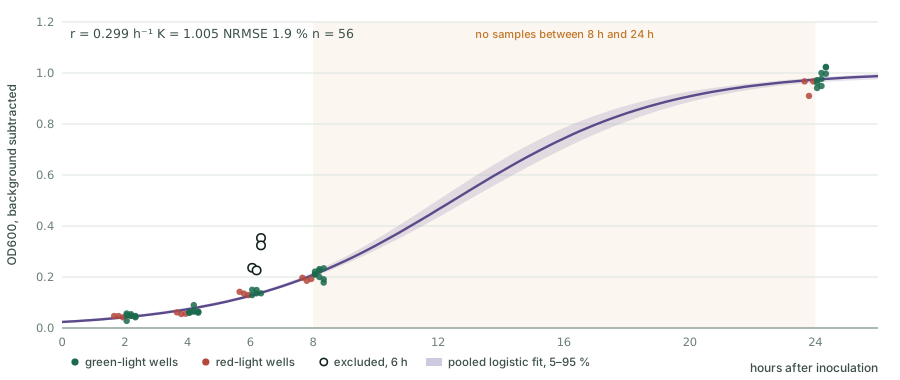
This fit is the prior we registered on 1 October and scored on the 14 to 16 October bioreactor run (R5). The rate crossed from the plate to the bioreactor; the ceiling did not.
What the results amount to
The green-light decision making questions
| Key question | Which result settles it | The number |
|---|---|---|
| Is our OD reading accurate? | R1, photometer against TiO₂ and SiO₂ | Slope 1.018 against the BioDrop to OD 1.2; a threefold dilution returns within 0.2% |
| When does the OD reading stop being accurate? | R2, autoencoder on the sensor and process axes | 26.7 h of warning before the channel gave out; 31 of 1,083 windows gated in run 6 |
| What could the B. subtilis growth look like an hour in the future, without green light activation? | R5, Kalman filter | 41% less error at 2 h than assuming nothing changes |
| What could B. subtilis growth look like under green light? | R6 prior, scored | Growth rate 0.286, inside the 0.2705 to 0.3300 interval registered a fortnight earlier |
| Can the bioreactor vessel keep delivering? | R4, pressure and flow | Shear from two independent sensors agrees to 2.8%; fouling rose 2.0 to 3.8 kPa over 42 h, far from cleaning |
| When does the crop need the protectant? | R3, field sensors and the weather forecast, and the math model connection | Bench only: the leaf sensor reads 1.2 to 1.9 °C warm, and nothing is on a plant yet |
| How much protectant is actually there? | ELISA for how much, DNPH for whether it works: an anti-His ELISA on samples drawn through the run, read off a logit standard curve, and the DNPH assay reading α-ketobutyrate, the product of the ACC deaminase reaction | About 5 µg/mL of ACC deaminase across both October runs, between 3.4 and 6.5 and flat over 41 h; 0.5503 mM α-ketobutyrate after 3 h of induction, our best activity figure. Both from single samples |
Read down that column and the decision assembles itself from two directions.
From the field. The forecast and the crop-stress rule give an hour at which the crop comes under stress. Protectant takes time to make, so the light has to come on before that hour, not at it. The twin subtracts one from the other.
From the vessel. The prior says what this strain does before the batch starts, so a target time exists on hour zero. The Kalman filter updates it as the run proceeds. The trust layer decides whether the readings feeding both are worth using, and the fouling trace says whether the membrane will still be passing permeate when the moment arrives.
Where the two meet is the answer. If the culture reaches the needed density before the field needs the protectant, the twin names the hour to induce. If it does not, the useful output is the opposite: this batch cannot meet this demand, and the grower learns that days early rather than on the day of stress.
The last number is the one that says a batch is worth harvesting, and the two assays are the first readings of it. The ELISA says how much enzyme the run made, about 5 µg/mL, flat from the first hour to the forty-first: that strain secretes constitutively, so this is what a run makes with no light on it at all. The DNPH assay says the enzyme works, and puts 0.5503 mM of α-ketobutyrate against three hours of induction. Neither can yet set the induction length. Both are single samples, the activity reading sits below the assay's quantitation limit, and the two readouts of it disagree twenty-twofold depending on how long the reaction ran. So the twin can say when the culture will be ready, and a person still decides how long to leave the light on, from a sample drawn by hand and carried to the bench. Repeating the assays on an induced batch, and fitting green light to the bioreactor, are what close the loop.
The Software
The Digital Twin
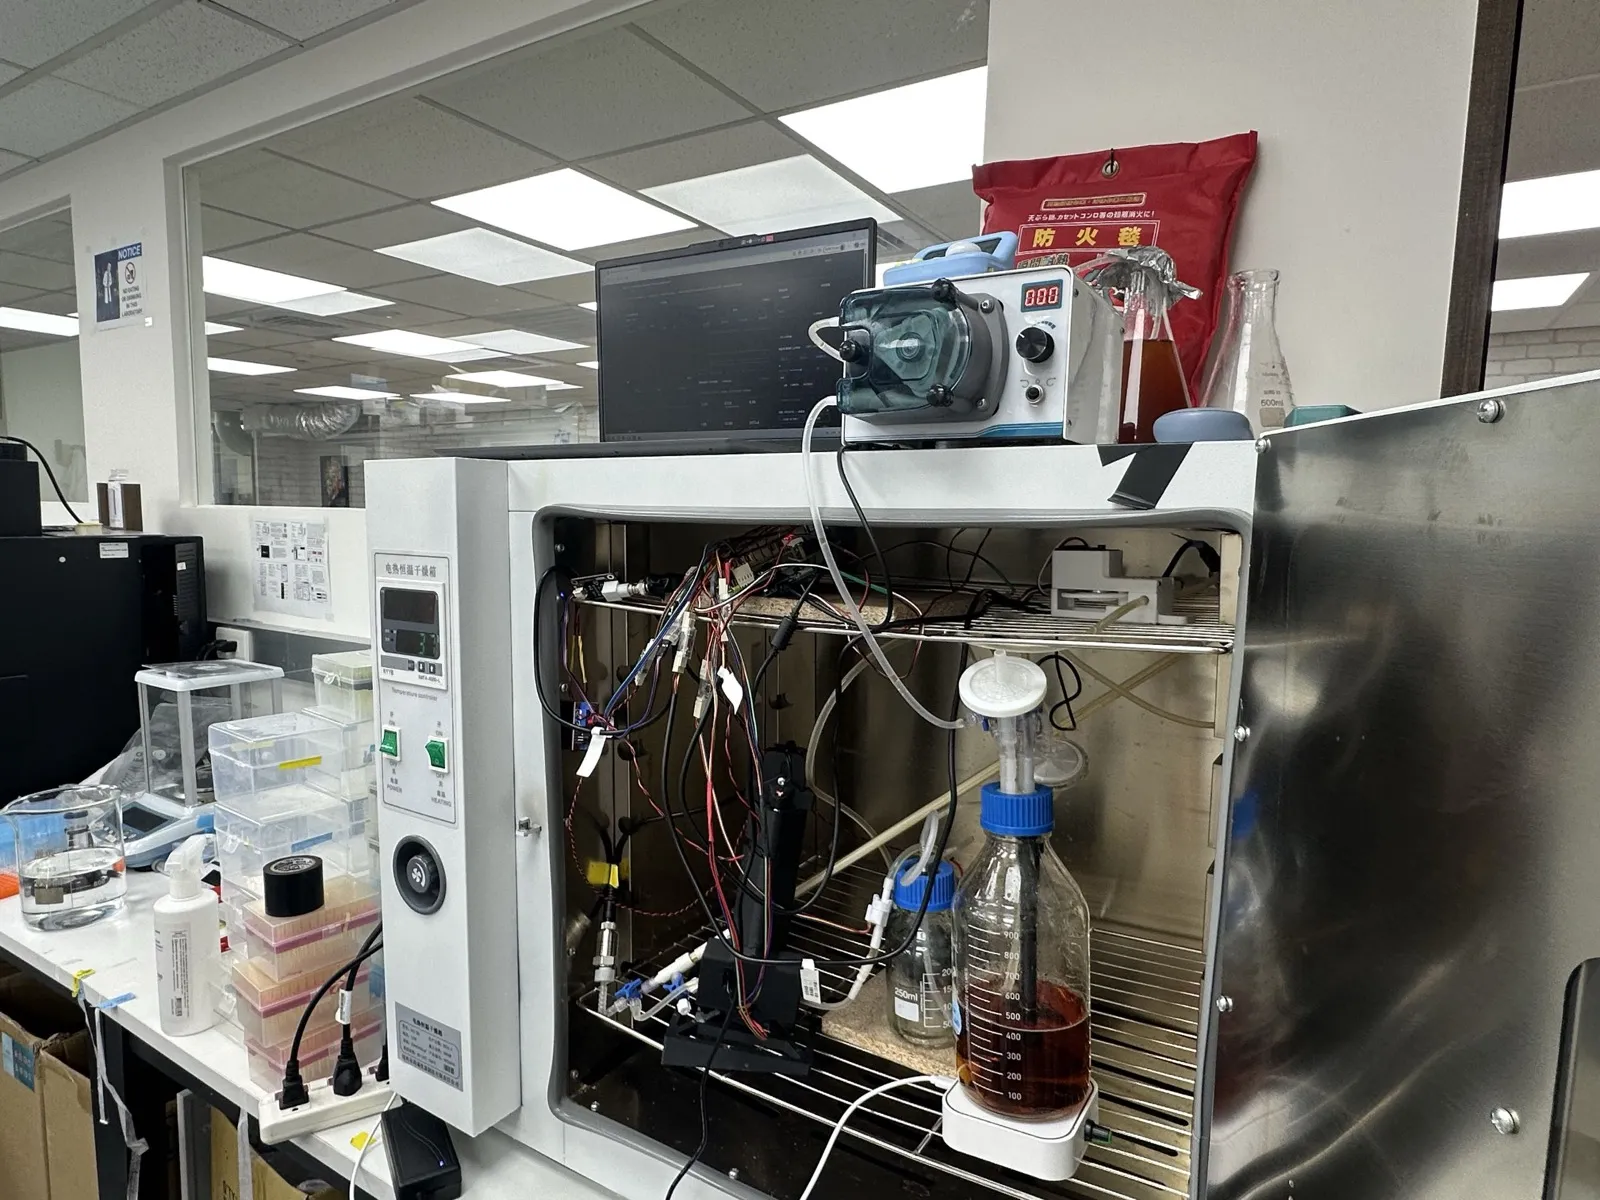
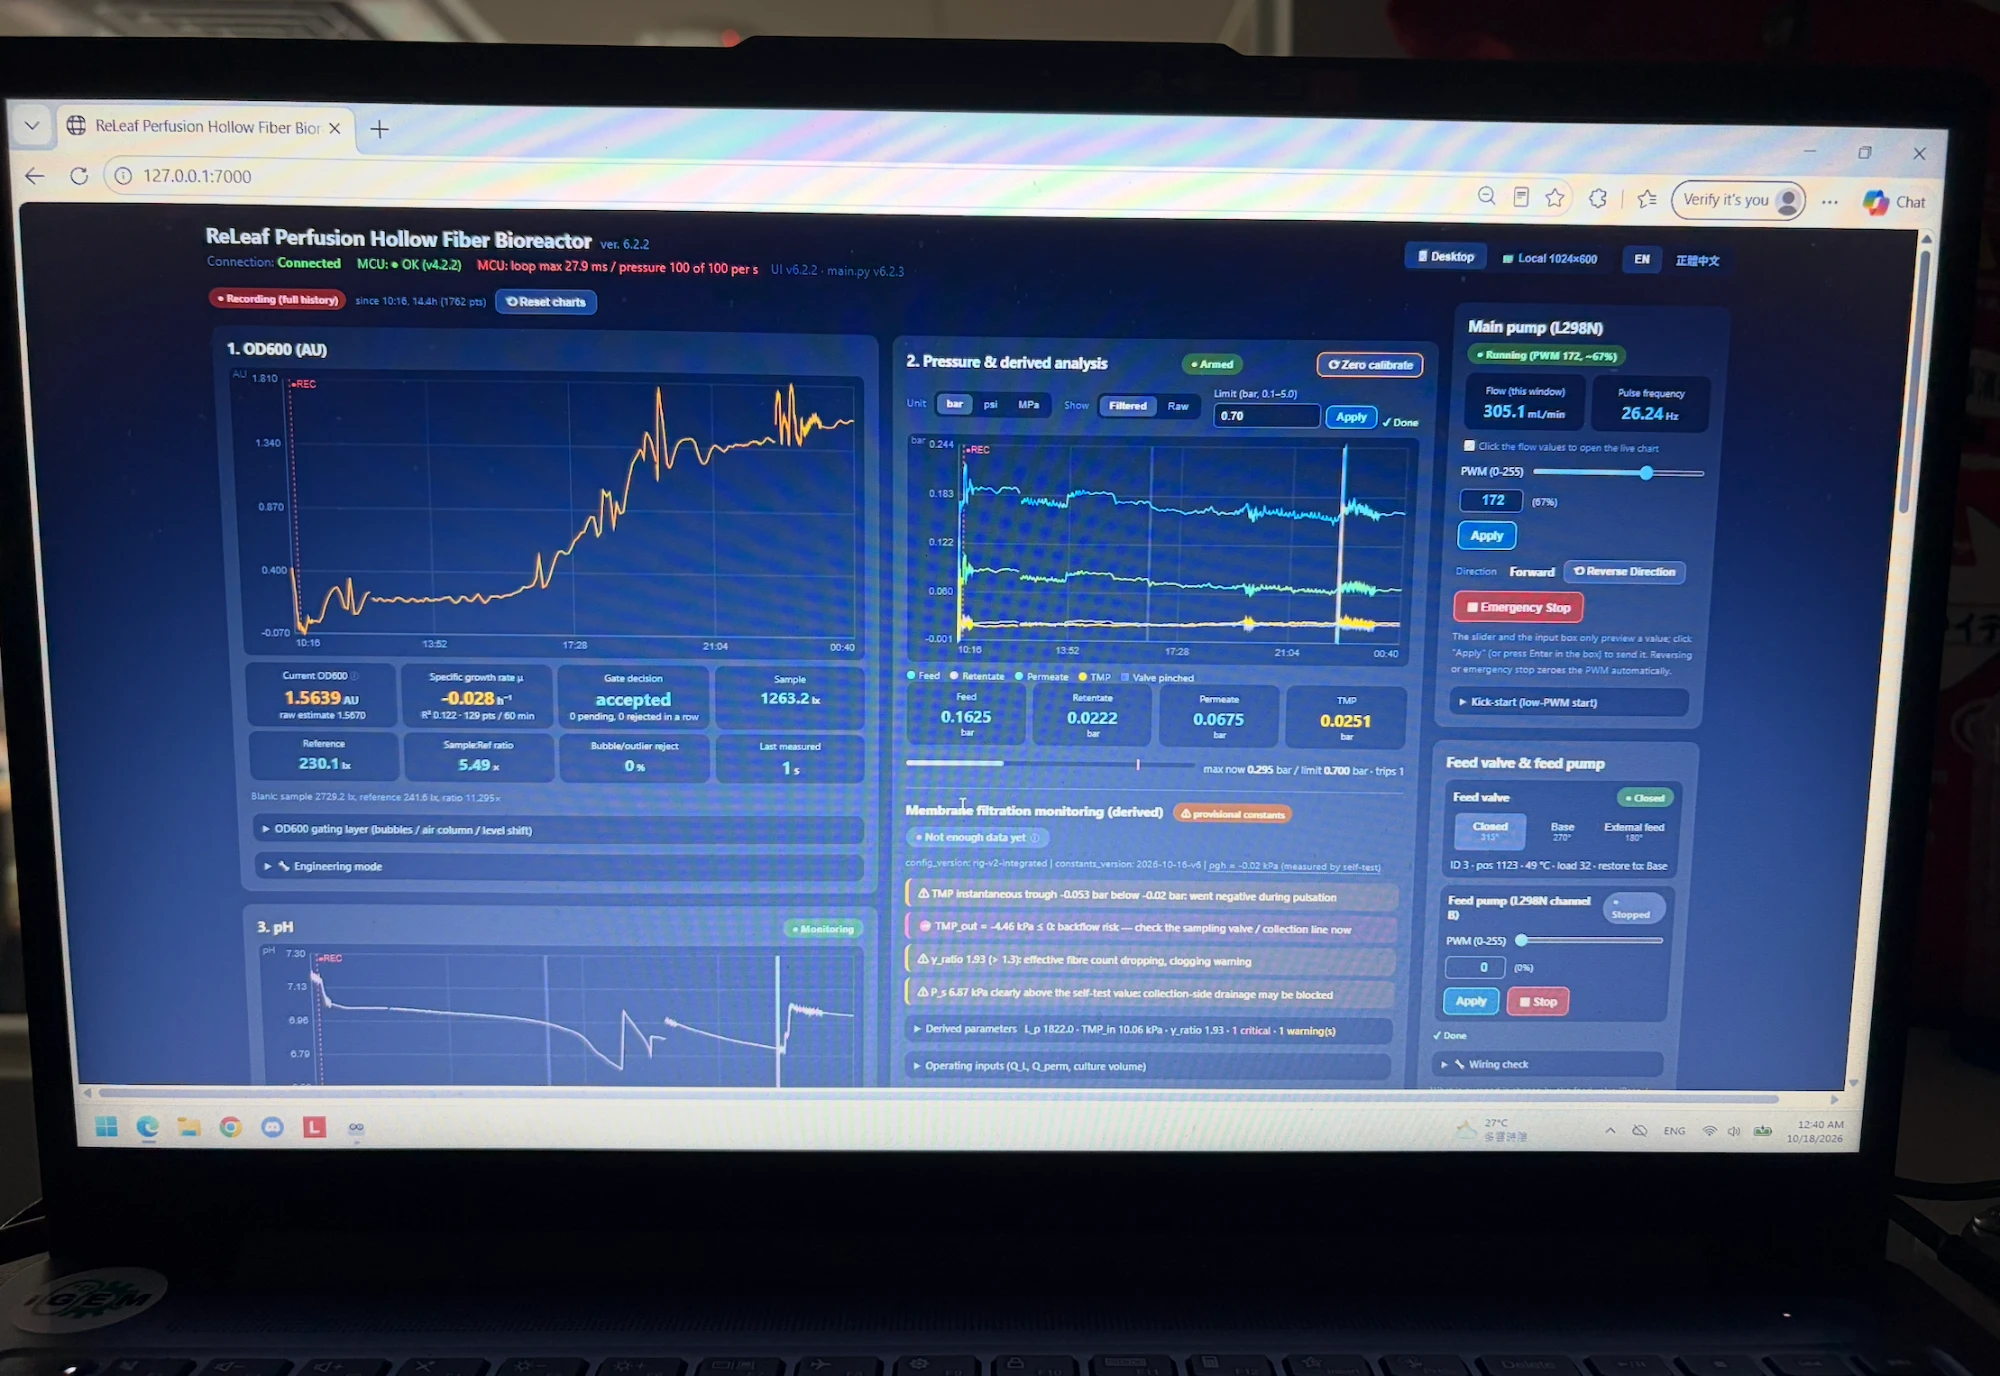
It has three parts. Firmware v4.2.2 (sketch/sketch.ino) runs on the Uno Q's microcontroller, samples the instruments and holds every interlock, including a pressure trip that stops the pumps when any of the three pressure channels passes 0.70 bar. Backend v6.2.2 (python/main.py and five modules beside it) runs on the board's Linux side, computes optical density, growth rate, the membrane values and the alarms, runs the automatic pH control, writes the log to the board's disk and serves the page on port 7000. Interface v6.2.2 (assets/index.html) is one file in the browser: it shows the live readings and sends the pump and valve commands, and holds no interlock of its own. The firmware pushes readings to the backend and the backend calls the firmware for commands, over the board's Bridge link.
This is the version we froze the wiki with. Run 6 was recorded on v5.1 and runs 1 to 5 on earlier versions. Since v5.1 it adds a feed pump that doses base under automatic pH control, a shell sampling valve, a feed valve and the pressure trip. These have been run against a simulated board; of them, only the feed pump has been wired to the real one.
The next Digital Twin
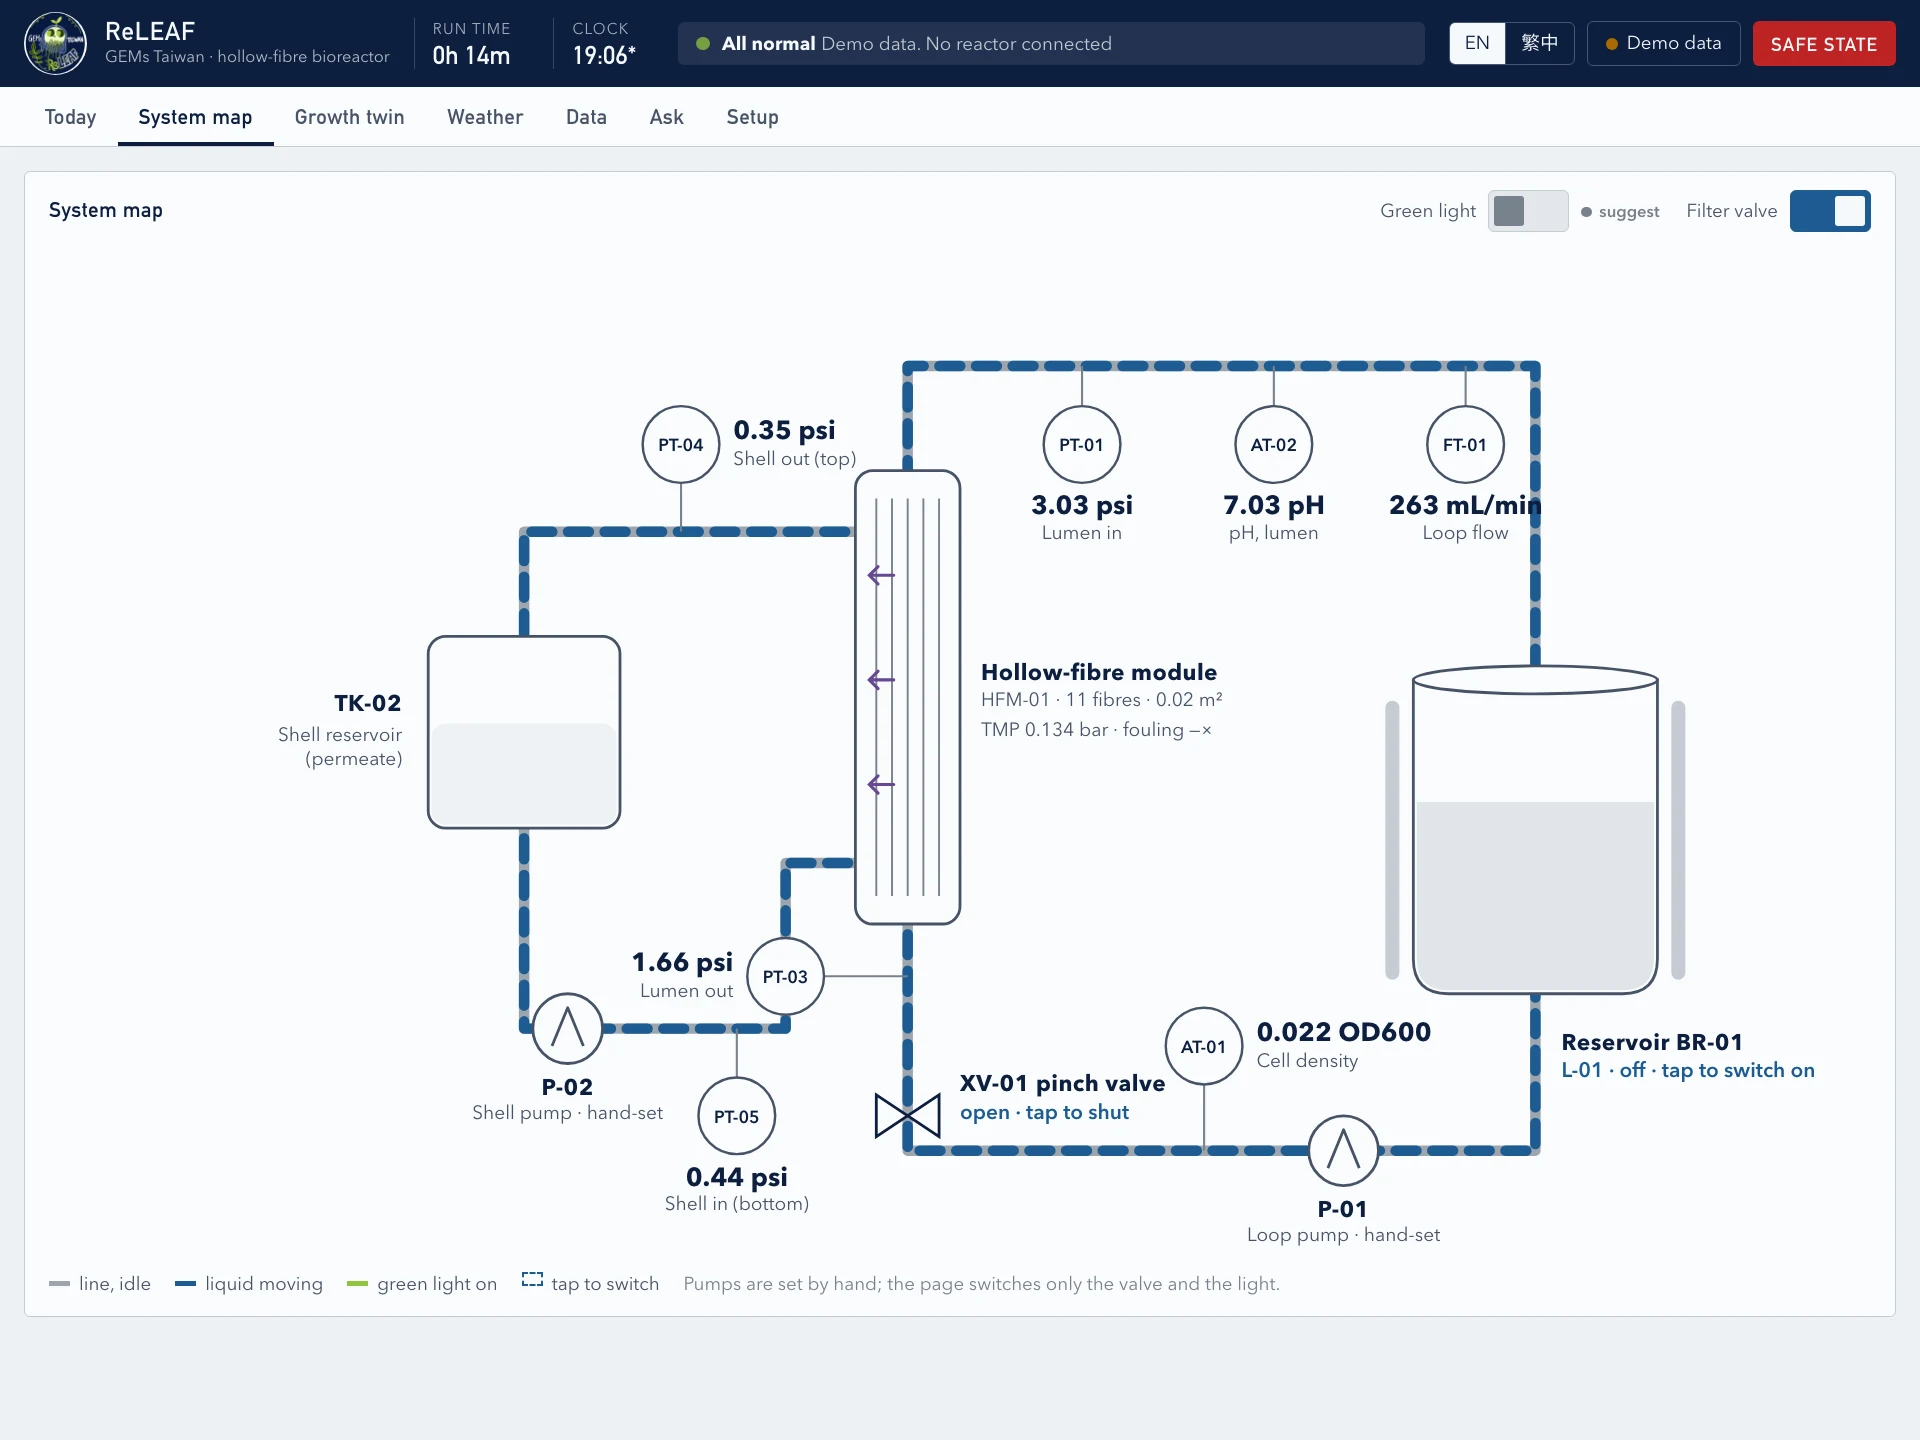
The digital twin we ran in experiments has not integrated leaf wetness data and weather forecast predictions into the green light trigger decision, due to time constraints. We did develop this new digital twin for future testing that has six tabs: what to do now, a live dashboard, the growth twin against its forecast band, weather and blast risk, the batch record, and setup. And a self learning function that allows users to record every run's results and data for more precise future predictions.
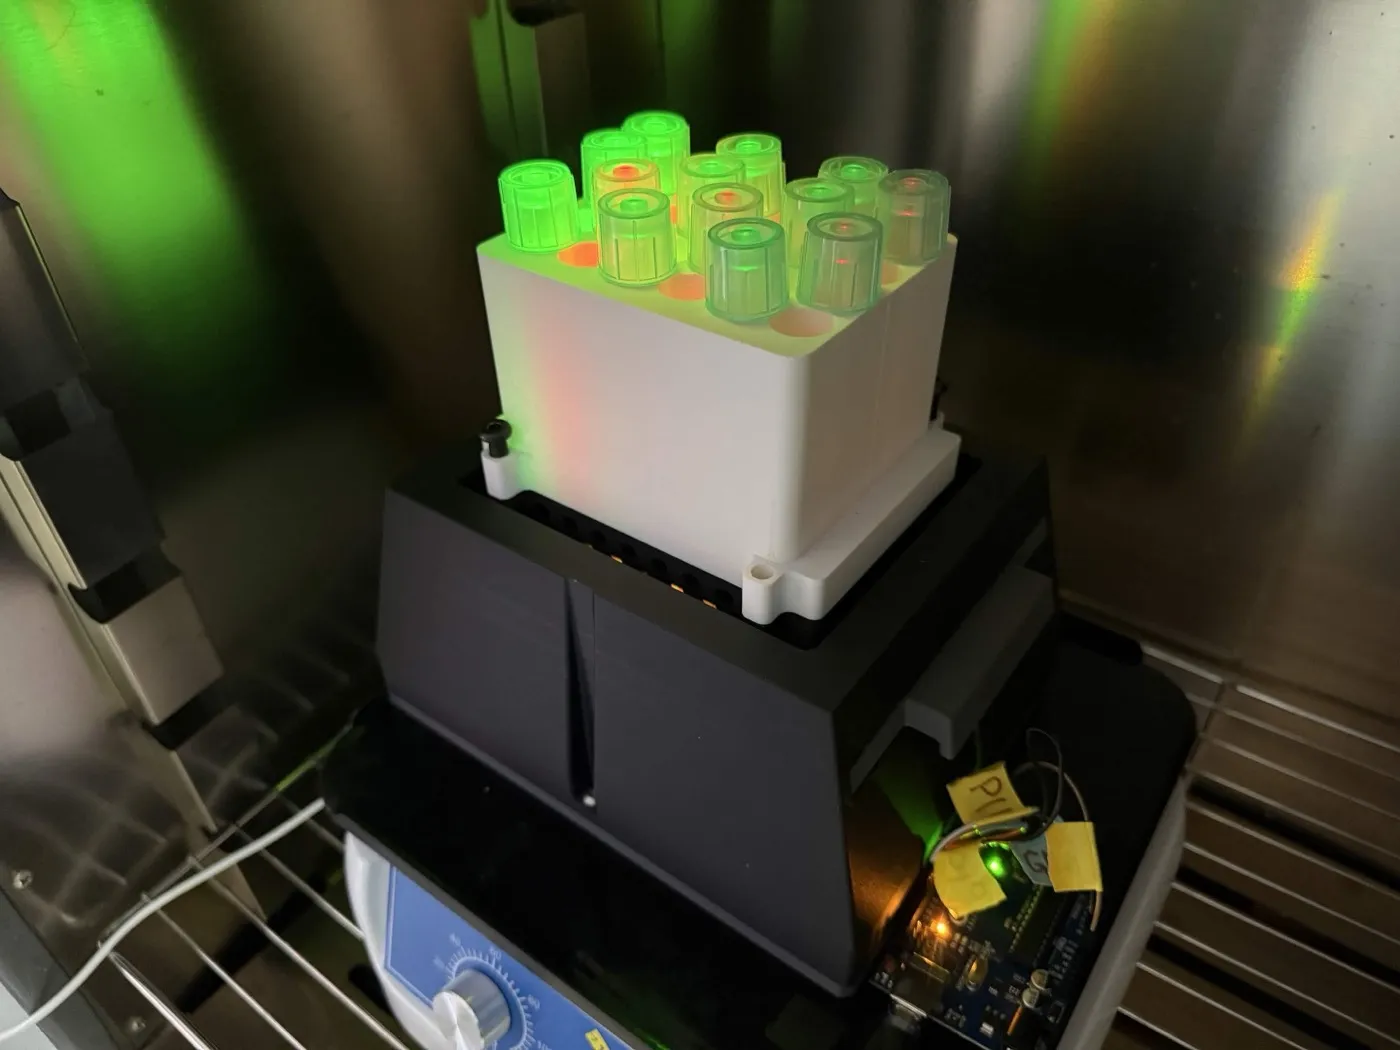
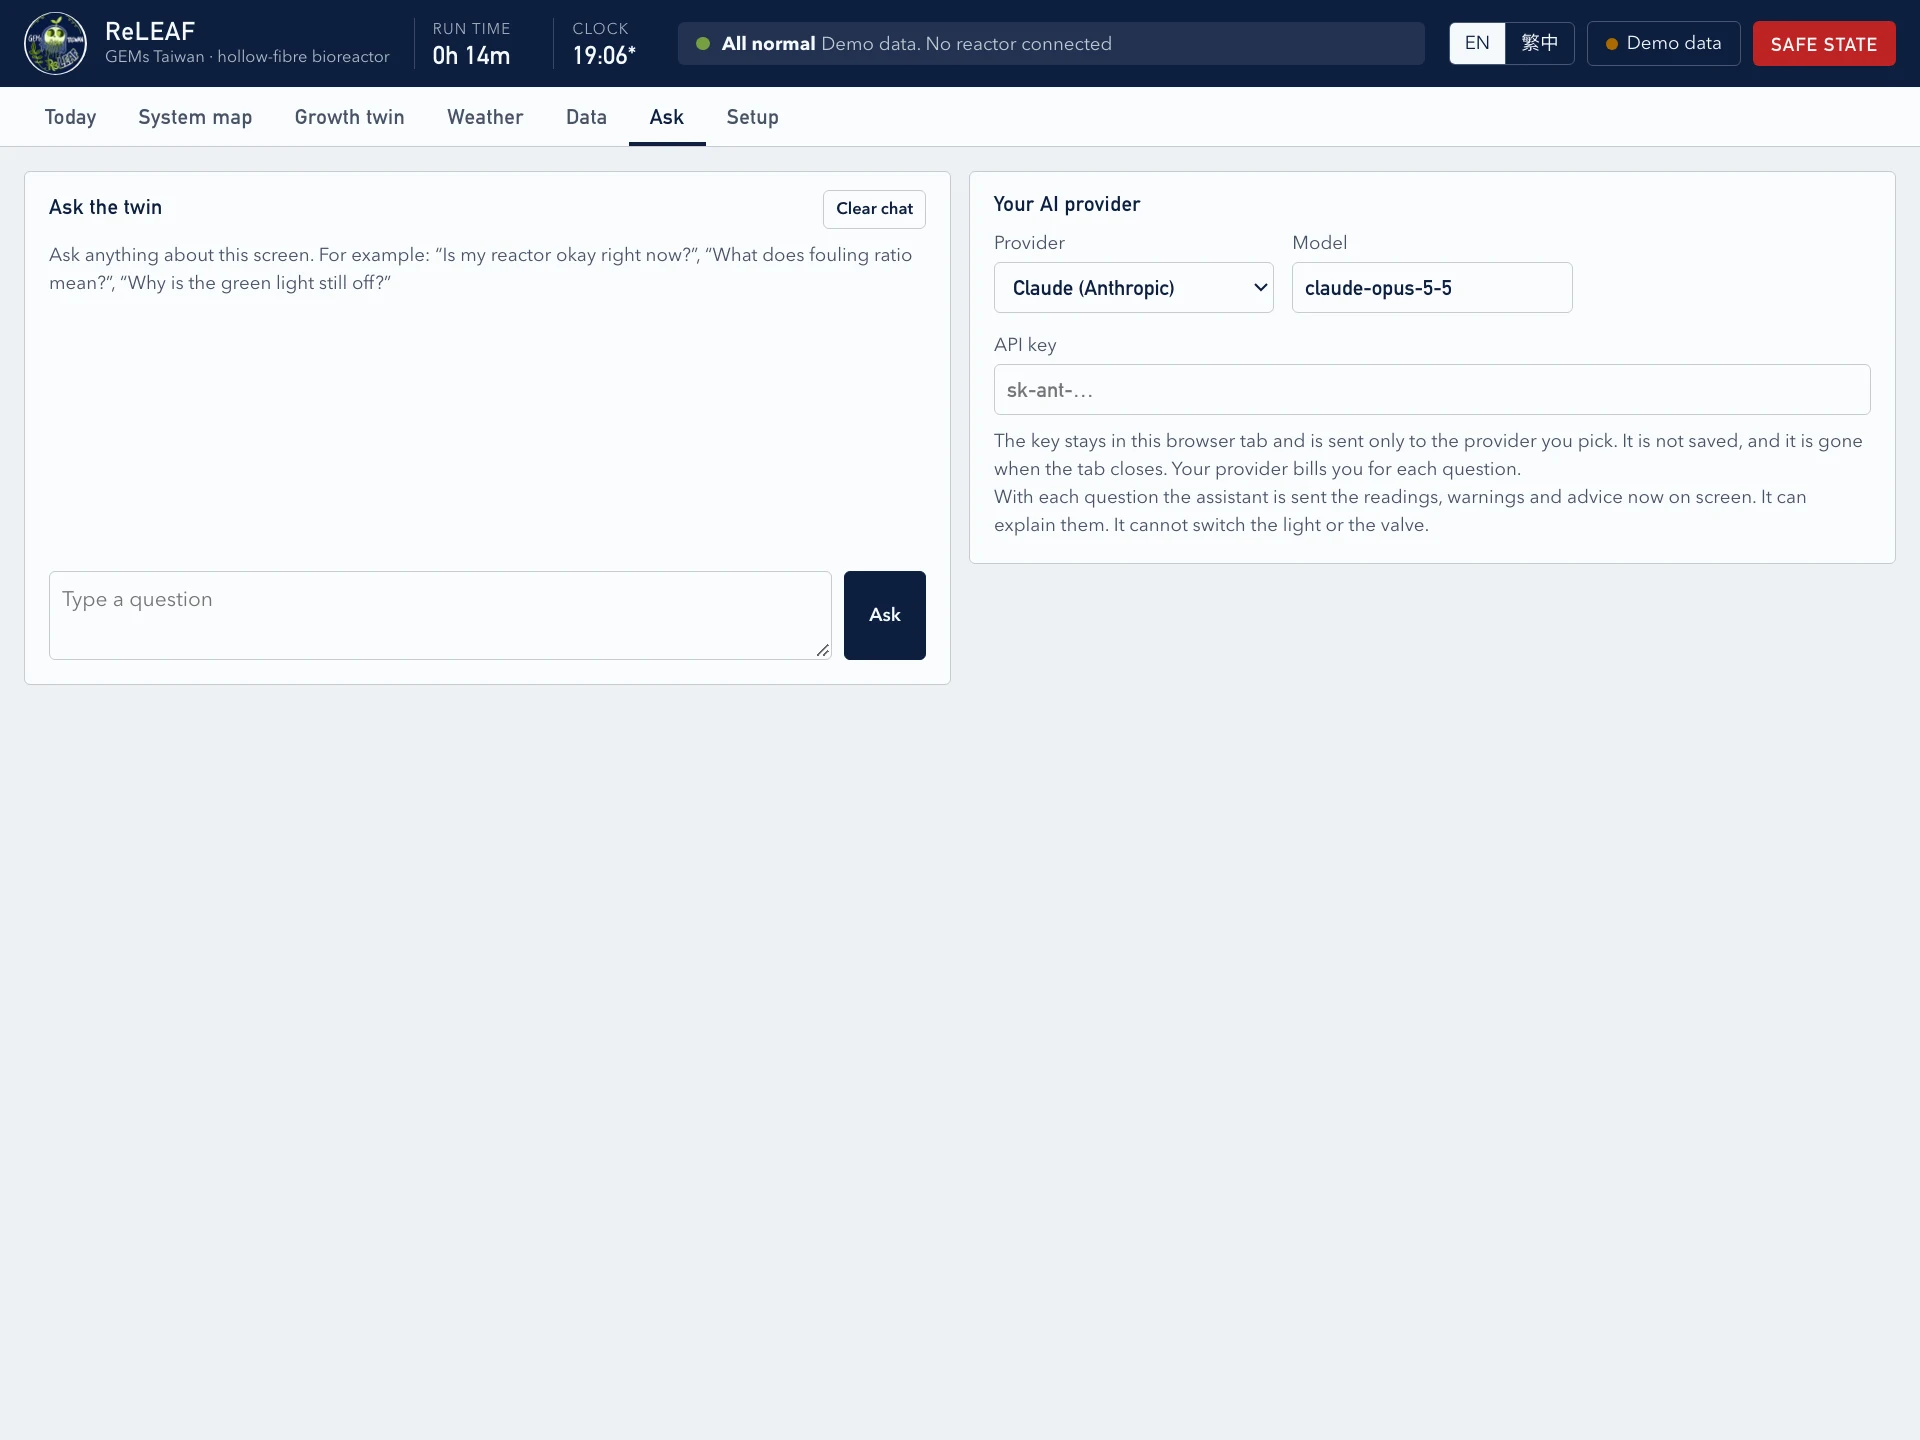
In the Ask tab, the farmer users can paste an API key from their own AI provider (Claude, ChatGPT or Gemini) and can then ask about the screen in plain language, such as whether the bioreactor is fine or why the green light is still off. With each question the assistant receives the readings, warnings and advice on screen. It can explain them and cannot move a valve or the light. The key stays in the browser tab and is not saved. On the iGEM wiki the chat is switched off, because the wiki allows no request to an outside server.
Current limits
Four things are not yet in the twin. Loop temperature: the probe is fitted but has not been answering, so the runs used a temperature typed in by the operator. Dissolved oxygen: we had trouble calibrating the sensor and neither probe can be autoclaved, so it is not on the bioreactor. Green light on the bioreactor: induction was tested on the light-programmable array and is not built into the bioreactor, so the twin cannot yet switch it on. Induction light in the culture: it is not measured, and a dense culture will dim it by an amount nothing on the bioreactor reads.
The October runs added a fifth. The in-line photometer has a top end: somewhere above an optical density of 2.7 the sample beam fell to a tenth of the reference, and the reading stepped to about 9.9 and stayed there for the last four hours of run 6. The acceptance gate marks those windows as low signal, which is enough for the twin to stop trusting them and not enough to recover a number from them. Above that density the bioreactor is blind until someone draws a sample by hand.
References
- Portela, R. M. C., Varsakelis, C., Richelle, A., Giannelos, N., Pence, J., Dessoy, S., & von Stosch, M. (2021). When is an in silico representation a digital twin? A biopharmaceutical industry approach to the digital twin concept. Advances in Biochemical Engineering/Biotechnology 176, 35–56. doi:10.1007/10_2020_138
- Gargalo, C. L., Caño de las Heras, S., Jones, M. N., Udugama, I., Mansouri, S. S., Krühne, U., & Gernaey, K. V. (2021). Towards the development of digital twins for the bio-manufacturing industry. Advances in Biochemical Engineering/Biotechnology 176, 1–34. doi:10.1007/10_2020_142
- Koshimizu, Y. (1988). [BLASTAM, leaf blast forecasting from AMeDAS weather data; in Japanese.] Bulletin of the Tohoku National Agricultural Experiment Station 78, 67–121. Cited from secondary sources; the original was not read.
- Yoshino, R. (1979). [Leaf wetness duration and temperature required for rice blast infection; in Japanese.] Bulletin of the Hokuriku National Agricultural Experiment Station 22, 163. Cited from secondary sources; the original was not read.
- Sentelhas, P. C., Dalla Marta, A., Orlandini, S., Santos, E. A., Gillespie, T. J., & Gleason, M. L. (2008). Suitability of relative humidity as an estimator of leaf wetness duration. Agricultural and Forest Meteorology 148, 392–400. doi:10.1016/j.agrformet.2007.09.011
- Sinner, P., Daume, S., Herwig, C., & Kager, J. (2021). Usage of digital twins along a typical process development cycle. Advances in Biochemical Engineering/Biotechnology 176, 71–96. doi:10.1007/10_2020_149
Licence
Both programs, the Digital Twin and the next Digital Twin, are released under the MIT licence. The text is in software/LICENSE, beside the Digital Twin's source in software/rig-app/. Both are published in iGEM's software repository as well, gitlab.igem.org/2026/software/gems-taiwan/digital-twin, with the running instrument under rig-app/ and the browser twin under next-twin/. The wiki's own text and figures stay under CC BY 4.0.